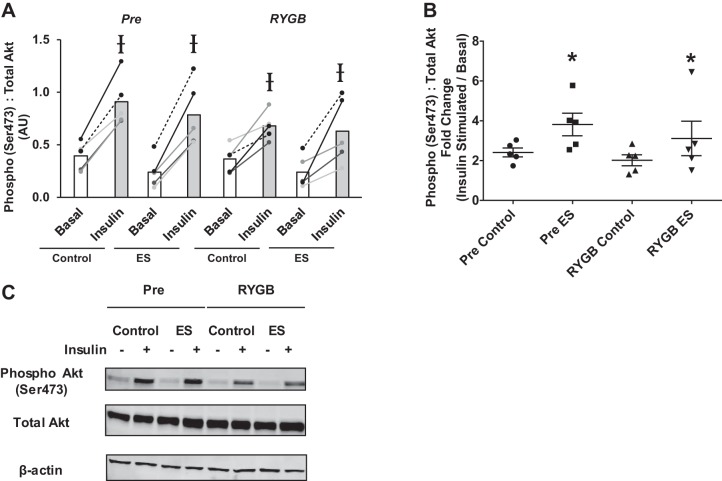
Fig. 2.
Absolute (A) and relative (B) basal and insulin-stimulated phosphorylation of Akt (Ser473) in myotubes derived from RYGB patients before (Pre) and after surgery (RYGB) under control conditions and after 24 h of pulsed electrical stimulation (ES). Values are means ± SE in arbitrary units (AU; A) and fold change (insulin stimulated/basal; B); n = 5 subjects/group. Ɨ P < 0.05 vs. basal, denoting an insulin effect. *P < 0.05 vs. Control, denoting an electrical stimulation effect. C: representative immunoblot images for phospho-Akt, total Akt, and β-actin.

