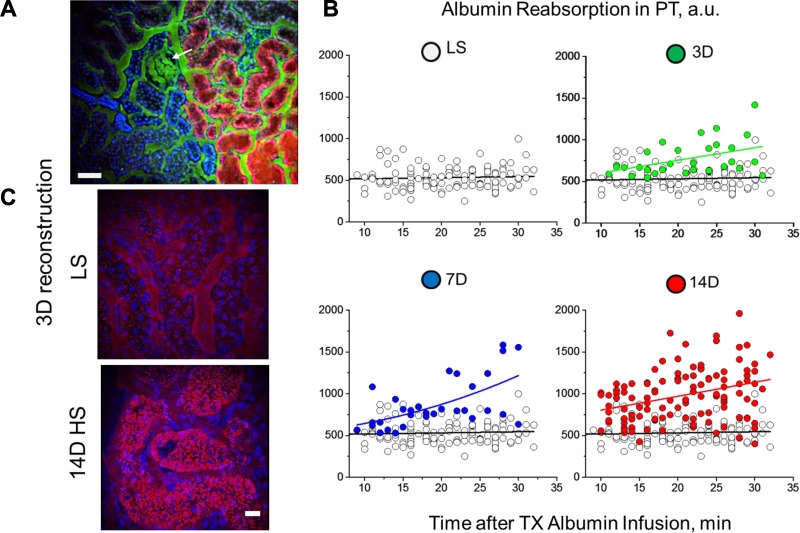
Fig. 3.
Evaluation of proximal tubular reabsorption of albumin during salt-sensitive hypertension. A: 3-dimensional reconstruction of low-magnification screening (IRAPO ×25 W objective, NA 1.0; Leica) shows the glomerulus (arrow), albumin filtered through and actively reabsorbed by proximal tubules (TR-albumin; red), vasculature (150-kDa FITC-labeled dextran; green), and nuclear staining (Hoechst; blue) in proximal and distal (dense blue color) tubules. Scale bar, 100 µm. B: time-dependent changes in TR-albumin (from the initial infusion to >30 min) in proximal tubule (PT) of SS rats fed a LS or HS (3D, 7D, and 14D) diet. Note that PT albumin reabsorption in rats fed a LS diet showed a linear dependence with well-balanced uptake and transcytosis (○). Control reabsorption values are plotted in all of the graphs to demonstrate the differences before and after HS treatment. PT reabsorption increased significantly in a stepwise manner under HS conditions (no. of tubules varies from 30 for 3D and 7D to 110 for LS and 14D groups). C: representative images of PT reabsorbing TR-albumin (28 min after infusion) following consumption of a LS or 14D HS diet (3-dimensional reconstruction of 25 z-stack intravital images). Note the significant increase in TR-albumin (red) reabsorbed by PT under HS diet conditions. Scale bar, 20 µm.

