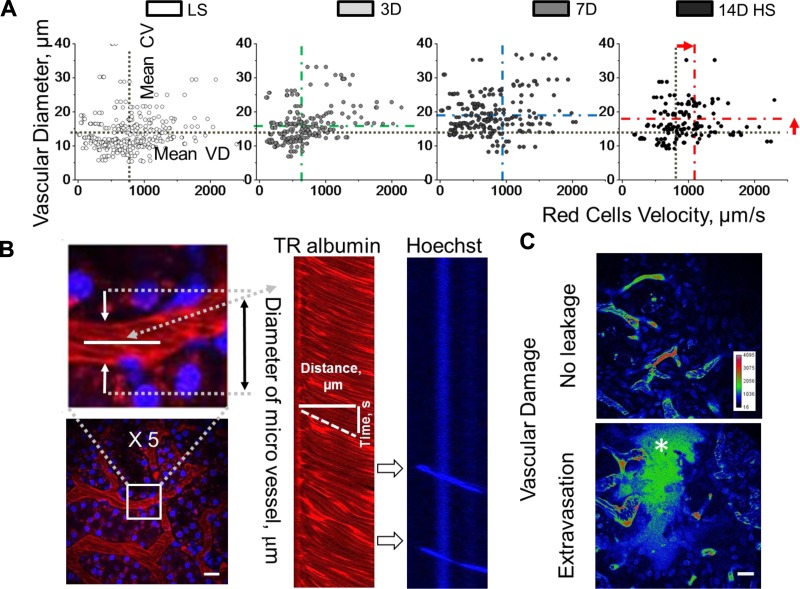
Fig. 6.
Assessing blood flow and vascular pathologies in the kidney. A: cortical renal blood vessel flow rates were evaluated by scanning red blood cell (RBC) velocity. Changes in blood flow and vascular diameter following high salt consumption; n = 339, 225, 225, and 225 vessels for LS, 3D, 7D, and 14D HS, respectively; *P < 0.05 for LS compared with 7D and 14D HS. B: representative images demonstrating the blood vessel line scans used to measure RBC velocity (µm/s) and microvessel diameter (µm). At right is a line scan example that tracks the movement of red blood (red) or white cells (blue) correspondingly. C: vascular extravasation of high-molecular weight molecules was assessed by injecting of 150-kDa FITC-Dextran and scoring the obtained indexed images in the renal cortex of experimental animals (P < 0.05). Top (LS-fed rats): there is no leakage of the 150-kDa Dextran into the interstitial space. Inset: shows the color intensity calibration bar. Bottom (14D HS-fed rats): high-intensity fluorescence within the interstitial space (*) closely matching the plasma intensity. Scale bars, 100 µm for all images.

