Figure 6.


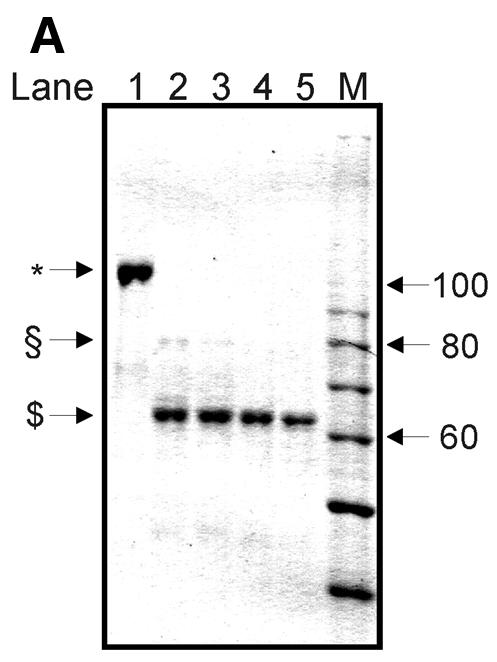
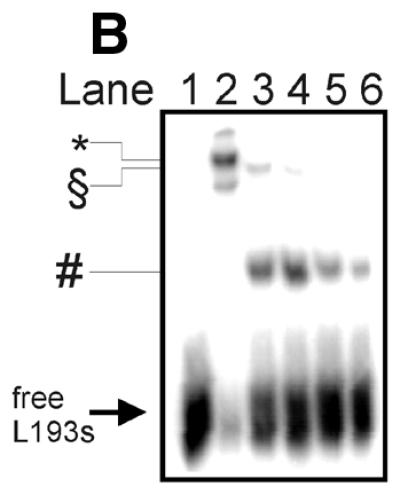
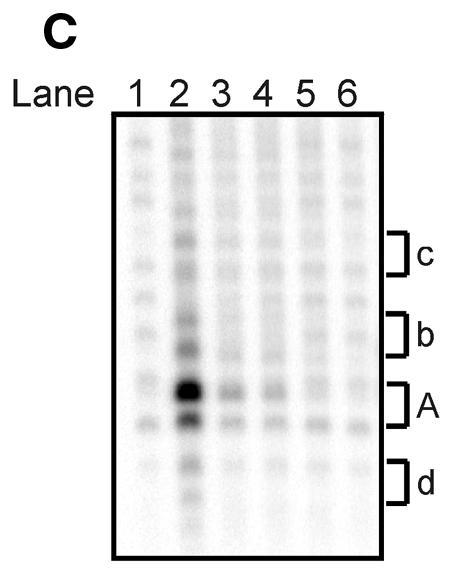
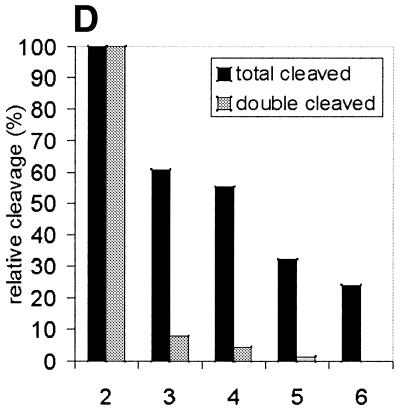
Limited digest of baculovirus-expressed htopoI with subtilisin. (A) Coomassie staining of a 7.5% polyacrylamide gel showing the partial digest of htopoI by subtilisin. HtopoI (2 µg) was incubated with 0, 20, 40, 60 and 120 ng subtilisin for 20 min at room temperature and 800 ng htopoI of each reaction was loaded in lanes 1–5 respectively. Full-length htopoI is indicated with an asterisk; htopoI lacking the N-terminus is indicated with a scroll symbol; core domain lacking the N- and C-terminus is indicated with a dollar symbol; M indicates the 10 kDa protein ladder. (B) Autoradiogram of a 7.5% polyacrylamide gel. L193s was incubated with: lane 1, no htopoI; lanes 2–6, htopoI; and subtilisin at a concentration of , 20 (lane 3),40 (lane 4), 60 (lane 5) and 120 ng (lane 6). The asterisk represents the shift caused by suicide cleavage of full-length htopoI; the scroll symbol represents the suicide cleavage of htopoI missing the N-terminus (80 kDa); the hash symbol represents the suicide cleavage of the C-terminal domain and the core domain; however, only the C-terminal domain is covalently attached to the substrate. (C) Autoradiogram of a 14% sequencing gel. The same numbering is used as in (B). (D) The results from (B) and (C) were quantified and depicted in a column chart. The numbering on the x-axis represents the same as described in (B) and (C). Black bars represent the relative degree of suicide cleavage and quantify the results shown in (B); gray bars represent the relative degree of second cleavage site ‘A’ and quantify the results shown in (C).

