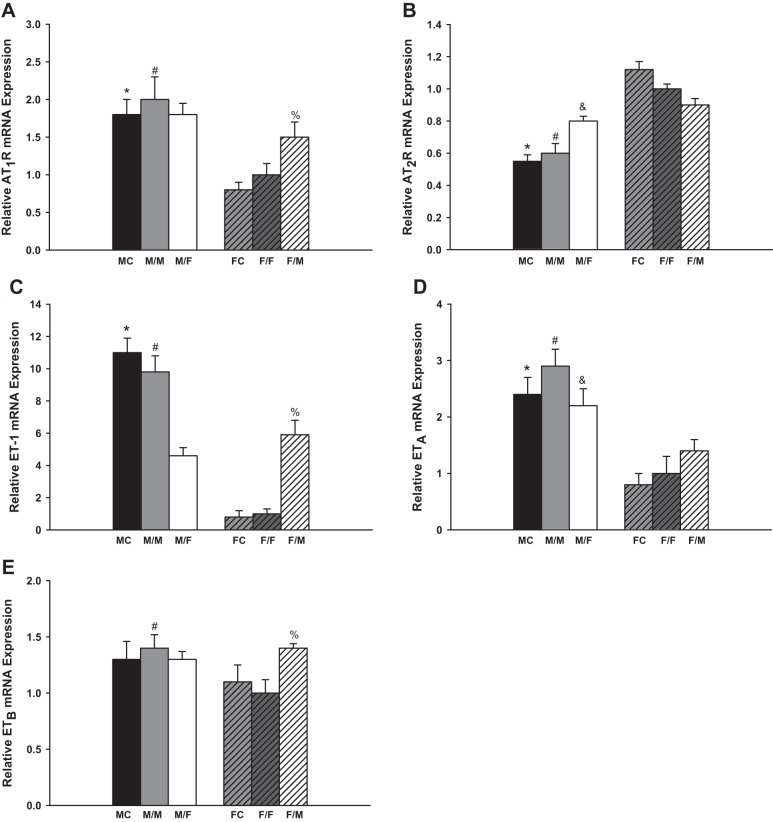
Fig. 1.
The relative renal gene expression of the components in renin-angiotensin system (RAS) and endothelin (ET) system. M, male; F, female; FC, female control; MC, male control; AT1R and AT2R, angiotensin II receptors. Renal gene expression of AT1R (A; *P < 0.01 vs. FC; #P < 0.01 vs. F/F; %P < 0.05 vs. F/F); AT2R (B; *P < 0.01 vs. FC; #P < 0.01 vs. F/F; &P < 0.05 vs. M/M); ET-1 (C; *P < 0.01 vs. FC; #P < 0.01 vs. F/F and M/F; %P < 0.01 vs. F/F); ETA (D; *P < 0.01 vs. FC; #P < 0.01 vs. F/F; &P < 0.05 vs. F/M); and ETB (E; #P < 0.05 vs. F/F; %P < 0.05 vs. F/F) of the transplanted kidneys at 4 wk after transplantation (donor/recipient; M, male, F, female; n = 6).

