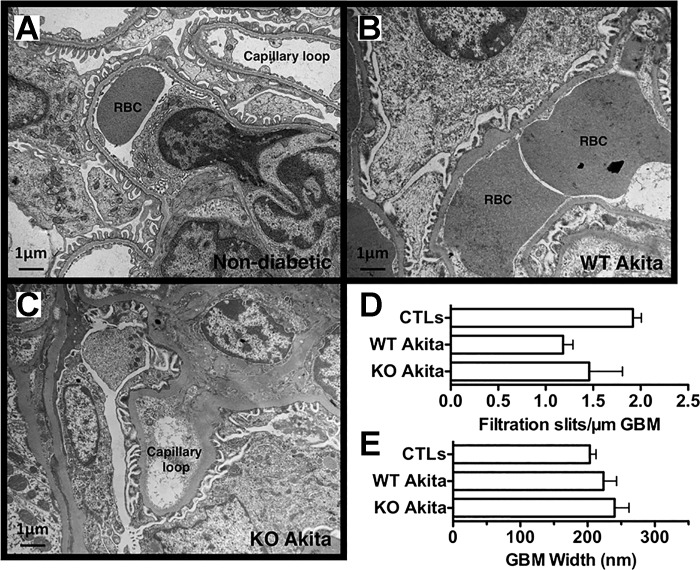
Fig. 5.
Glomerular ultrastructure in diabetic and nondiabetic mice. A–C: focal areas of foot process (FP) effacement were seen in both groups of Akita mice compared to nondiabetic controls (CTLs). RBC, red blood cell. D: number of filtration slits per micrometer (µm) of GBM tended to be decreased in both groups of Akita mice, but these differences were not statistically significant. E: glomerular basement membrane (GBM) width also tended to increase in both groups of Akita mice compared to nondiabetic CTLs, but these differences were not statistically significant. For the studies, four or five mice were studied in each group. Statistical analyses were performed using a two-way ANOVA followed by a Bonferroni post hoc analysis.

