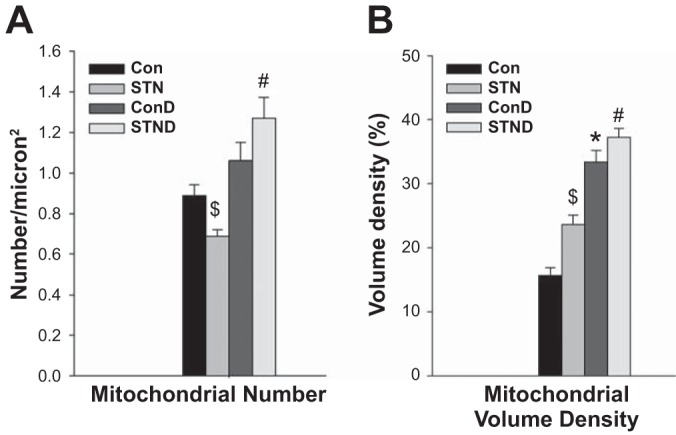
Fig. 7.

HIF-1α activation and mitochondrial morphology. A: mitochondrial number. Mitochondrial number per square micron were significantly elevated in the STN cortex with DMOG treatment. ANOVA P < 0.001, post hoc pairwise comparisons: #P < 0.01 STN+D vs. STN and $P = 0.02 STN vs. Con. B: mitochondrial volume density. In both control and STN cortical mitochondria, DMOG treatment increased mitochondrial volume density. ANOVA P < 0.001, post hoc pairwise comparisons: *P < 0.01, Con+D vs. Con, #P < 0.01 STN+D vs. STN, and $P < 0.01 STN vs. Con.
