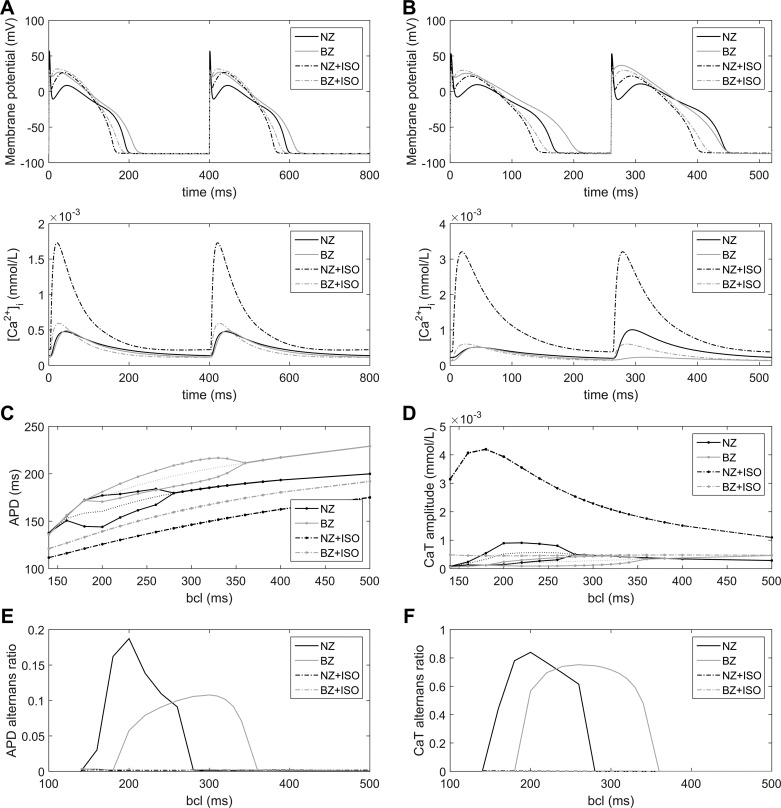
Fig. 2.
Effect of β-AR stimulation on the rate dependence of alternans. A: membrane potential and Ca2+ transients of the following four model configurations at a basic cycle length (BCL) of 400 ms: NZ cell, BZ cell, β-AR-stimulated (1.0 µmol/l ISO) NZ cell (NZ + ISO), and β-AR-stimulated BZ cell (BZ + ISO). B: analogous plot at a BCL of 260 ms, showing action potential (AP) duration (APD) and CaT alternans in NZ and BZ cases in the absence of β-AR stimulation. C and D: APD and CaT rate dependence curves for the four simulated configurations. Bifurcation in NZ and BZ curves indicates the occurrence of alternans. The dotted lines represent the mean of minimum and maximum APD during alternans. E and F: alternans ratio for APD and CaT alternans in the four groups.

