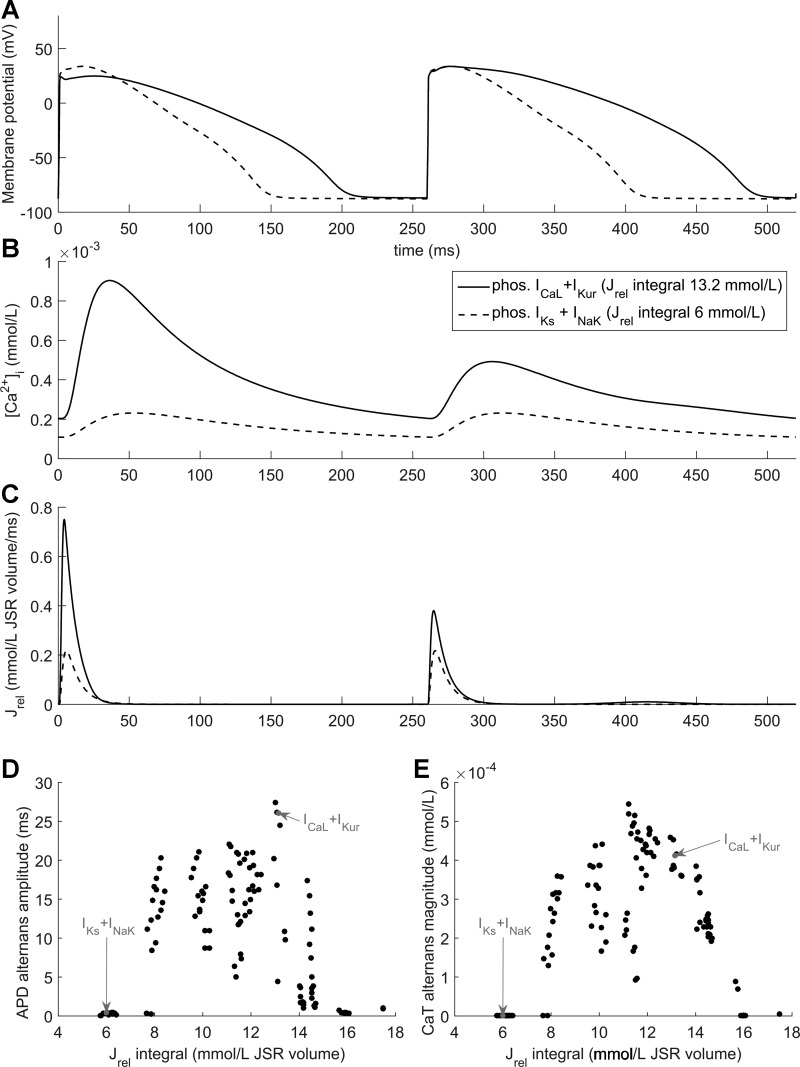
Fig. 3.
Role of SR Ca2+ release magnitude in alternans. A−C: AP (A), cytosolic Ca2+ concentration (B), and SR Ca2+ release flux (Jrel; C) for two combinations of downstream β-AR stimulation effects (phosphorylated ICaL and IKur, solid line; phosphorylated IKs and INaK, dashed line) at a BCL of 260 ms. D and E: magnitude of APD (D) and CaT (E) alternans for all 27 = 128 different combinations of downstream effects of β-AR without RyR2 activation versus the integral of Jrel over two consecutive APs; the two conditions shown in A–C are indicated with arrows.

