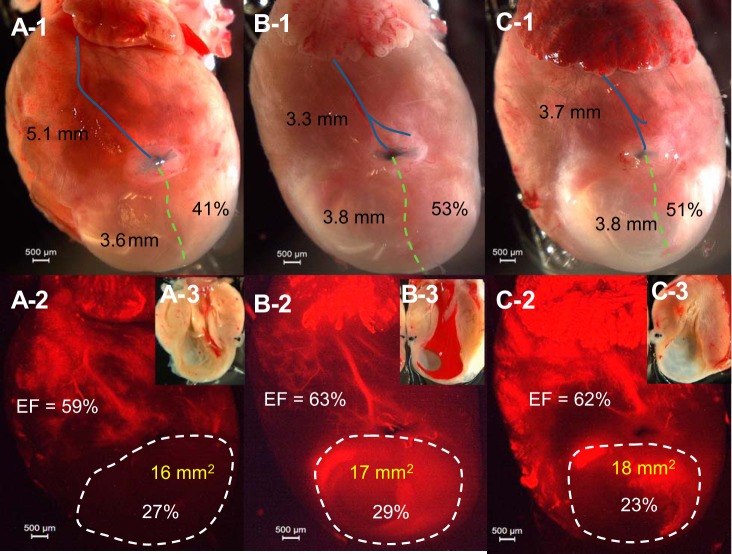
Fig. 4.
Ligation on LCA main trunk results in a larger MI. A,1, B,1, and C,1: direct photos showing that ligature level is identical but corresponds to different percentages of length of the LCA (41–53%). The blue line shows the distance from ligation to atria (in mm), and the green dashed line shows the distance from ligation to the apex. (Percentage = distance from ligation to apex/total length of the LCA). A,2, B,2, and C,2: fluorescent imaging of the heart. The MI area is shown by white dashed line (area and percentage of heart shown) and EF (in %) of that heart is shown. EF was obtained by 2-D mode, and MI area was obtained by echo. A,3, B,3, and C,3: direct photos of MI in the left ventricle (LV). The same heart is shown in A,1–3 (same for B,1–3, and C,1–3).

