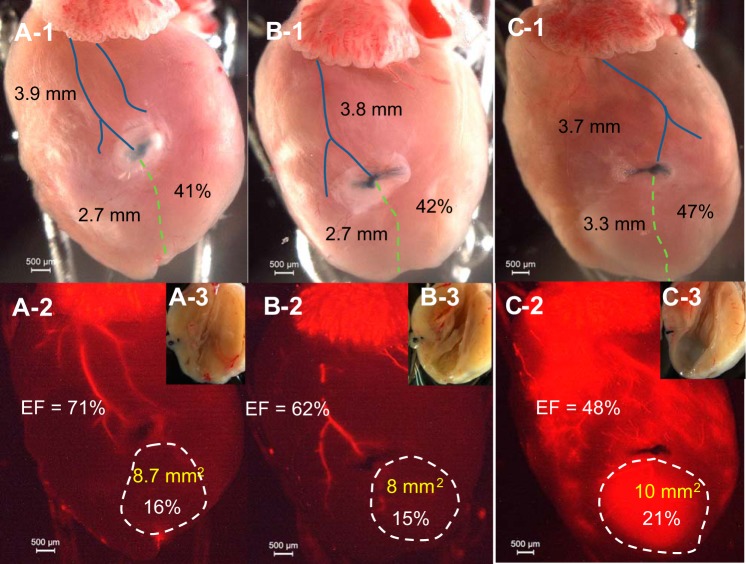
Fig. 5.
Ligation on LCA branch results in a moderate MI. A,1, B,1, and C,1: direct photos showing that ligature level is similar and corresponds to similar percentages of length of the LCA (41–47%). The blue line shows the distance from ligation to the atria (and distance in mm), and the green dashed line shows the distance from ligation to the apex. (Percentage = distance from ligation to apex/total length of the LCA). A,2, B,2, and C,2: fluorescent imaging showing that MI size is moderate. The MI area is shown by the white dashed line (area and percentage of heart given) and EF (%) of that heart is shown. EF was obtained by 2-D mode, and MI area was obtained by echo. A,3, B,3, and C,3: direct photos of MI in the LV. The same heart is pictured in A,1–3 (same for B,1–3, and C,1–3).

