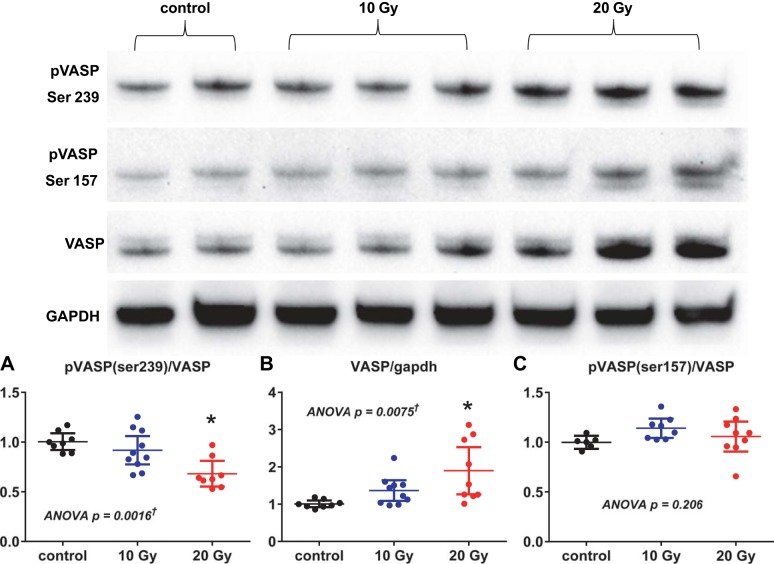
Fig. 11.
In vivo PKG activity assessed by vasodilator-stimulated phosphoprotein (VASP) phosphorylation. Top: representative Western blots for VASP and pVASP. Bottom: the ratio of pVASP (Ser239) to VASP (A) was decreased, while the VASP-to-GAPDH ratio (B) was increased in radiated rats; the ratio of pVASP (Ser157) to VASP (C) was not different between groups. Data are shown as scatter dot plots, with lines showing mean and 95% confidence interval. *P < 0.05 vs. control. †Post hoc test for linear trend P < 0.003.

