Fig. 3.
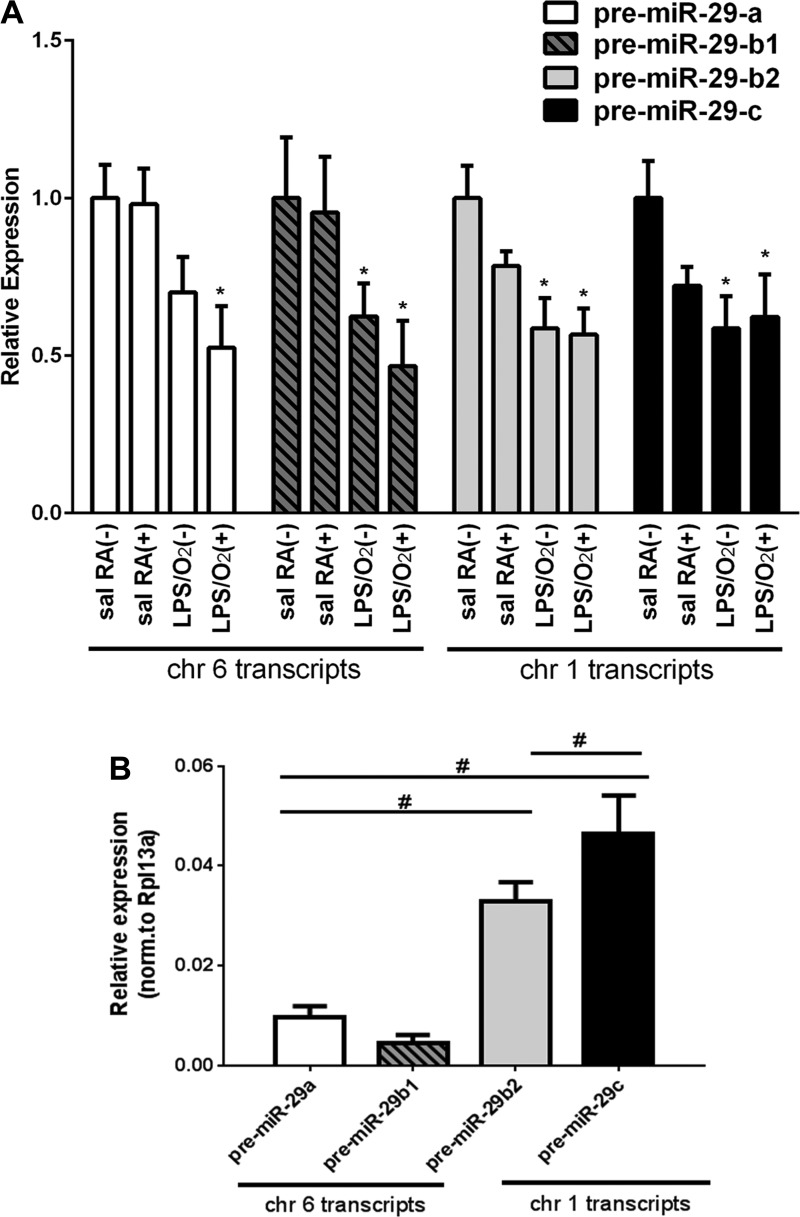
Pre-miR analysis of miR-29 transcripts. The expression of pre-miR-29a, pre-miR-29b1, pre-miR-29b2, and pre-miR-29c was measured in RNA extracted from lung tissues at PN14 of mice treated with a single dose of AAV9-miR-29b(+) or control(−) at PN3. A: suppression of all pre-miR-29 isoforms was observed in LPS/O2-treated mice (RA, room air). Expression of each pre-miR was normalized to the housekeeping gene Rpl13a and to levels seen in each saline/RA(−) sample by ΔΔCt analysis. Average Ct values for saline/RA(−) pre-miR-29 transcripts: b1 = 26.4, a = 25.2, b2 = 23.2, c = 22.6. Data were analyzed by one-way ANOVA; miR29a, P = 0.032; miR29b1, P = 0.032; miR29b2, P = 0.014; miR-29c, P = 0.016 (n = 4 each group). *Dunnett’s post hoc analyses indicated differences between saline/RA and other treatment groups. B: relative expression of each pre-miR-29 was measured in RNA samples extracted from lung tissues at PN14 from AAV9-control(−) mice. Data were analyzed by one-way ANOVA; P = 0.029; n = 4 per group. #Tukey’s post hoc analysis indicated differences between group and the corresponding bars are shown.

