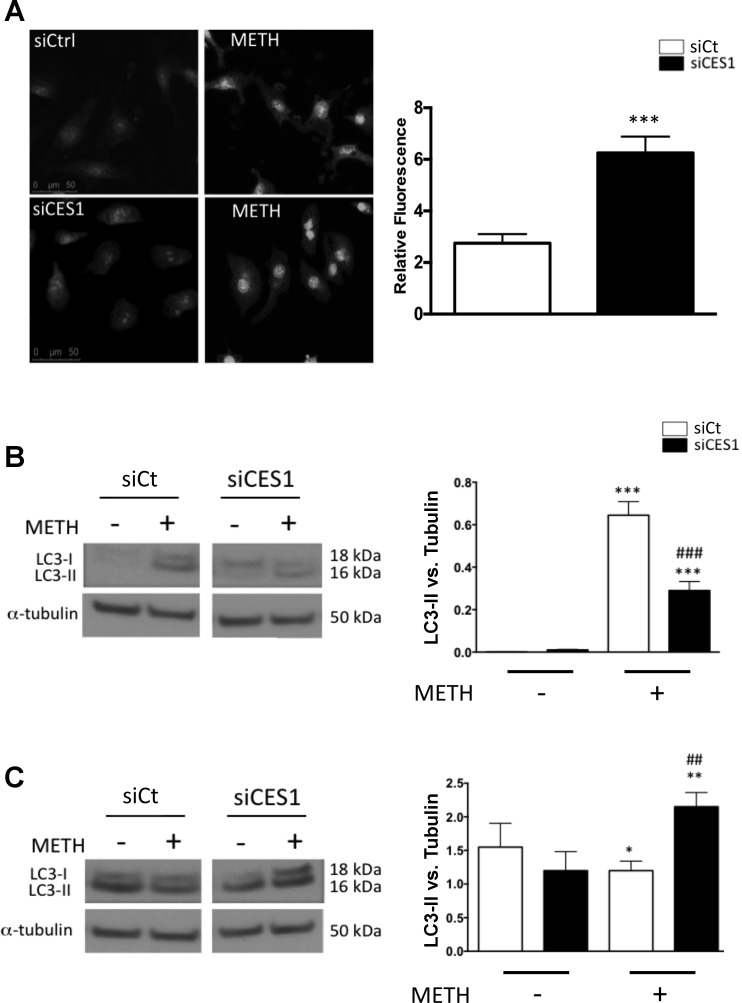
Fig. 6.
CES1-deficient PMVECs demonstrate reduced autophagy in response to METH. A: nonexposed and 4-h METH exposed control (siCt) and CES1 (siCES1) siRNA-treated cells were fixed and stained with CellRox green. Fluorescence was measured relative to Ctrl-no METH. ***P < 0.001, unpaired t-test. B: WB of unstimulated and 4-h-METH control (Ctrl) and siCES1-treated cells for LC3. C: WB of bafilomycin-treated unstimulated and 4-h-METH treated Ctrl and siCES1 cells for LC3. Densitometry is measured relative to tubulin as a loading control. In B and C: *P < 0.05, **P < 0.01, and ***P < 0.001 vs. siCt no METH; ##P < 0.01, ###P < 0.001 vs. corresponding control; 1-way ANOVA with Bonferroni posttest (n = 3).

