Fig. 7.
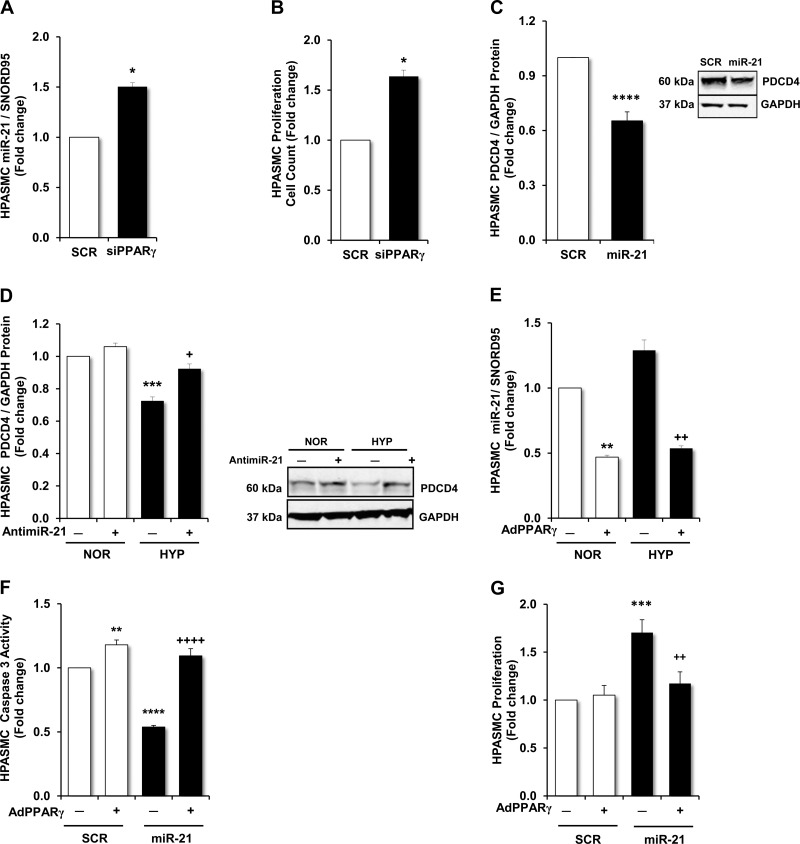
Effects of PPARγ on miR-21 expression and HPASMC proliferation and apoptosis. In selected studies, PPARγ was depleted by transfecting HPASMCs with siPPARγ (20 nM). A: demonstration of the expression of miR-21 in PPARγ-depleted HPASMCs compared with HPASMCs transfected with nontargeting scrambled oligonucleotides (20 nM). B: demonstration of the functional effects of PPARγ on HPASMC proliferation in PPARγ-depleted HPASMCs compared with HPASMCs transfected with nontargeting scrambled oligonucleotides. The effects of gain or loss of miR-21 expression on PDCD4 protein levels were examined. C: PDCD4 protein levels were measured in HPASMCs transfected with mature miR-21 mimics (30 nM) or nontargeting scrambled oligonucleotides (30 nM) with a representative immunoblot. D: PDCD4 protein levels were measured in HPASMCs exposed to normoxic (21% O2) or hypoxic (1% O2) conditions for 72 h. Six hours before the cells were placed in normoxic or hypoxic conditions, HPASMC monolayers were transfected with locked nucleic acid siRNA sequences targeting miR-21 (anti-miR-21; 1 nM) or nontargeting control locked nucleic acid scrambled RNA sequences (1 nM). Representative immunoblot is shown. E: miR-21 expression was measured in HPASMC monolayers exposed to normoxic (21% O2) or hypoxic (1% O2) conditions. Selected HPASMCs were transfected with AdGFP (10 MOI) or AdPPARγ (10 MOI) for 6 h at the onset of the study. RSG (10 μM) was added to the culture medium after 24 h of incubation and miR-21 levels were detected using quantitative RT-PCR upon the conclusion of the 72-h study. F and G: effects of miR-21 overexpression on apoptosis and proliferation in HPASMCs were examined. HPASMCs were transfected with AdGFP (10 MOI) or AdPPARγ (10 MOI) for 6 h at the onset of the study. After 24 h of incubation, RSG (10 μM) was added to all HPASMC monolayers and selected HPASMCs were transfected with mature miR-21 mimics (30 nM) or nontargeting scrambled oligonucleotides (30 nM). F: demonstration of the spectrophotometric detection of absorbance at 405 nm reflecting caspase-3 activity as an indicator of apoptosis. G: proliferation was measured in HPASMCs using automated cell counting. A and B: n = 3; *P < 0.05 vs. SCR. C: n = 9; ****P < 0.0001 vs. SCR. D: n = 9 and E: n = 3; **P < 0.01 vs. NOR(−); ***P < 0.001 vs. NOR(−); +P < 0.05 vs. HYP(−); ++P < 0.01 vs. HYP(−). F and G: n = 5–6; **P < 0.01 vs. SCR(−); ***P < 0.001 vs. SCR(−); ****P < 0.0001 vs. SCR(−); ++P < 0.01 vs. miR-21(−); ++++P < 0.0001 vs. miR-21(−).

