Fig. 4.
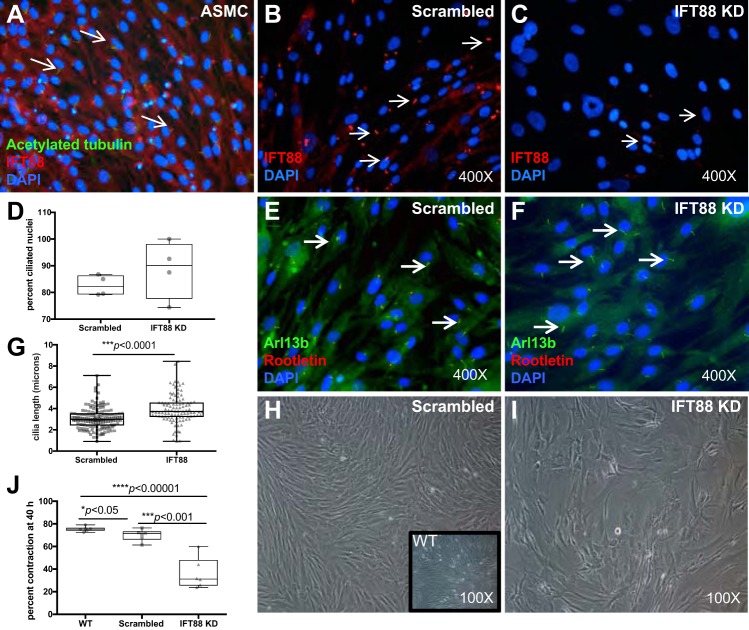
Knockdown of IFT88 expression in ASMCs reduces contractile activity in collagen gels. A: confluent and serum-starved ASMCs were stained with antibodies to acetylated tubulin (green) and IFT88 (red) to assess IFT88 expression and localization in PC. IFT88 colocalizes in the ciliary axoneme with acetylated tubulin (arrows). Image is at ×400 magnification. B and C: ASMCs were infected with 5 MOI of lentiviral vector containing shRNA to IFT88 or with scrambled control shRNA. Cells were stained with an antibody to IFT88 (red) to determine levels of expression and localization to PC. Nuclei are shown in blue (DAPI), and images are at ×400 magnification. D: percentage of ciliated nuclei was determined using four ×400 images of Arl13b and rootletin staining to indicate cilia and using DAPI to localize nuclei, comparing scrambled control (82.4%) with IFT88 KD (87.6%). Data are presented as box-and-whiskers plots, whereby boxes represent 25-75 percentile and whickers minimum to maximum values. E and F: to assess PC morphology in ASMCs following knockdown of IFT88 expression, cells were stained with antibodies to Arl13b (green) and rootletin (red). Arrows indicate cilia; images are at ×400 magnification. G: cilia length was measured with ImageJ software, using four ×400 images of Arl13b and rootletin staining to determine relative cilia length comparing scrambled control (n = 139 cilia measured) with IFT88 KD (n = 103 cilia measured). Data are presented as box-and-whiskers plots, whereby boxes represent 25-75 percentile and whickers minimum to maximum values. H and I: scrambled control and IFT88 KD cells were grown for 3 wk in culture, and light microscope images were taken (×100 magnification) to assess cellular morphology. Inset shows noninfected wild-type (WT) cells, at ×100 magnification. J: IFT88 KD and scrambled control ASMCs were combined with neutralized collagen and allowed to contract for 40 h. Gel areas were measured (n = 6 IFT88 KD and n = 6 scrambled control), and percent contraction from time 0 was determined. Data are presented as box-and-whiskers plots, whereby boxes represent 25-75 percentile and whickers minimum to maximum values.

