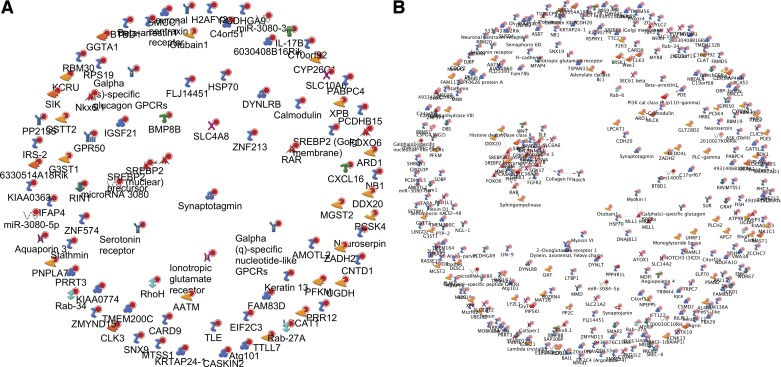
Fig. 7.
Network analysis of a list of genes with associated CpG methylation change within 10-kb distance of the transcript (n = 89) (A) and without the 10 kb filtration (n = 324) (B) seen in F1+F2+F3 generations; “direct links” algorithm. Notice minimal or no involvement in interacting pathways. Various symbols for the genes reflect whether the respective protein is membranous, nuclear, or cytoplasmic, and sometimes a functional designation; these are automatically generated by the software for illustrative purposes only.

