Fig. 7.
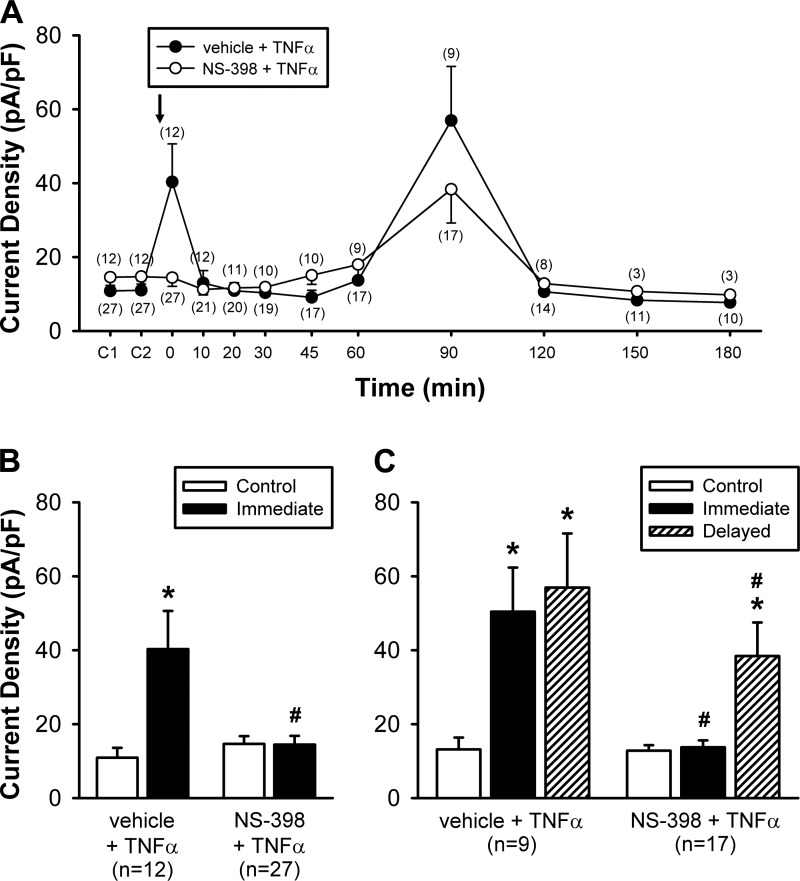
Group data illustrating the effect of NS-398 pretreatment on the TNFα-induced hypersensitivity of vagal pulmonary sensory neurons. A: histogram of the responses of current densities to the same concentration of Cap (0.1 or 0.3 µM, 3 s) challenges in the vehicle (of NS-398) + TNFα group (closed circles) and the NS-398 + TNFα group (opened circles); TNFα (1.44 nM, 9 min) was applied immediately following the NS-398 vehicle (0.1% DMSO) or NS-398 pretreatment (10 µM, 10 min), as depicted by the arrow. C1 and C2: responses to two consecutive Cap challenges separated by 10 min before TNFα; 0 min: responses immediately after the termination of TNFα. The number of neurons tested at each time point is shown in parenthesis. The number of neurons decreased progressively toward later stage of the experiment due to the difficulty of maintaining a complete seal of the patch recording in some of the neurons. B: comparison of the Cap-evoked peak current density responses between before (Control) and immediately after TNFα (0 min) in two groups of neurons: vehicle + TNFα group [n = 12: 6 nodose (N) and 6 jugular (J)] and NS-398 + TNFα group (n = 27: 12 N and 15 J). C: in only some of these neurons in B, both the immediate (0 min after TNFα) and delayed (60–90 min after TNFα) phases of the TNFα effect were recorded, and a comparison of the Cap-evoked peak responses between control (before), immediate and delayed phases in two groups of neurons: vehicle + TNFα group (n = 9: 3 N and 6 J) and NS-398 + TNFα group (n = 17: 8 N and 9 J). *Significantly different from the corresponding control; #significant difference between vehicle + TNFα and NS-398 + TNFα groups at the same time points. Data are means ± SE.

