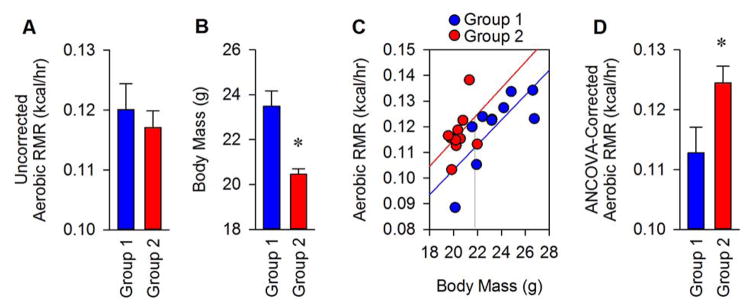
Figure 8. Illustration of an ANCOVA analysis.
(A) A simple comparison between two different groups indicates no difference in mean aerobic RMR between groups. (B) Comparison of body masses between groups uncovers a difference between groups, necessitating the reanalysis of RMR data to account for body size. (C) Metabolic rate values are plotted against the body mass of individual animals within each group, and linear regressions are performed for each group. Tests of homogeneity of regression are performed to confirm that the slope of lines through each group are indistinguishable. (In this case the lines are indistinguishable, p=0.96, so we can proceed with ANCOVA analyses). (D) The interpolated average RMR value (intercept) at the average body mass value for all animals in the study (21.97g) is then reported as the “ANCOVA-corrected” RMR value.

