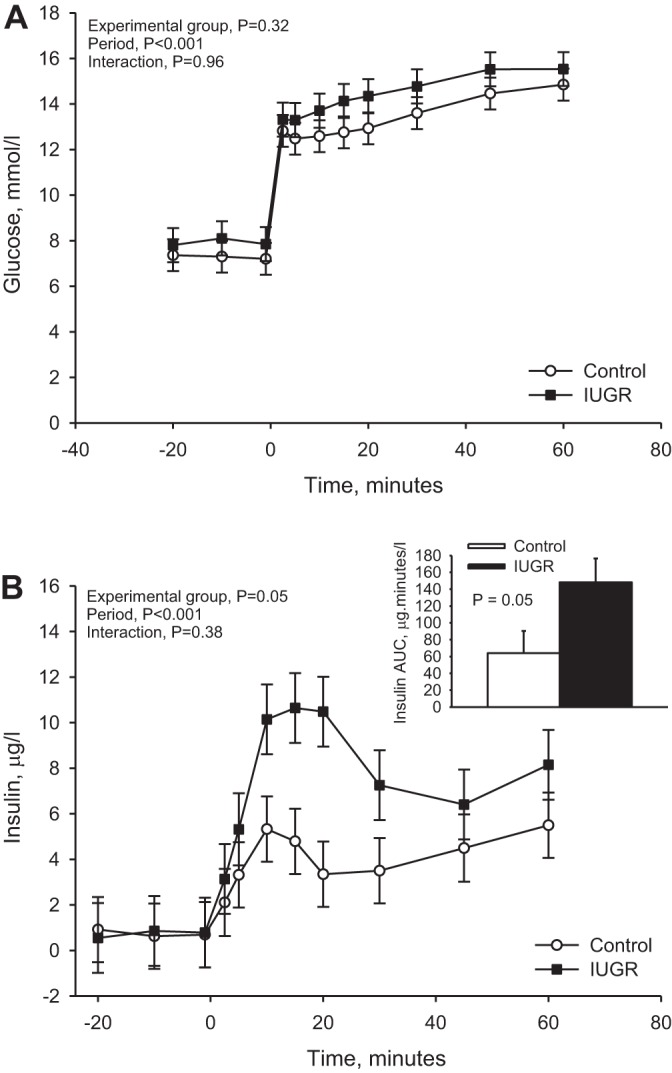
Fig. 1.

Glucose-stimulated insulin concentration. Square-wave hyperglycemic clamps were performed in control lambs (n = 8) and in lambs with placental insufficiency-induced intrauterine growth restriction (IUGR) (n = 7) at 8 days of age. A: plasma glucose concentrations (mmol/l) are presented for each sample time (y-axis, minutes), which is relative to the start of the glucose bolus (time = 0). B: plasma insulin concentrations (µg/l) are presented for each sampling point. The insulin area under the curve (AUC; µg·min−1·l−1) was calculated for the first 20 min of hyperglycemia, which represents acute, first-phase insulin secretion, and the AUC (means ± SE) is graphed in the inset. P values from the statistical analysis are reported in the top left corner of each graph.
