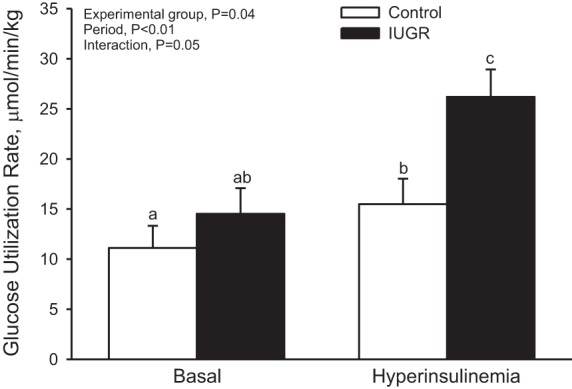
Fig. 3.

Glucose utilization rate. Rates of glucose utilization were measured with a radiotracer for d-glucose. Mean values are presented for control (n = 8) and IUGR (n = 5) lambs at basal and hyperinsulinemic steady states. There was an experimental group-by-period interaction, and the letters denote significant difference (P < 0.05).
