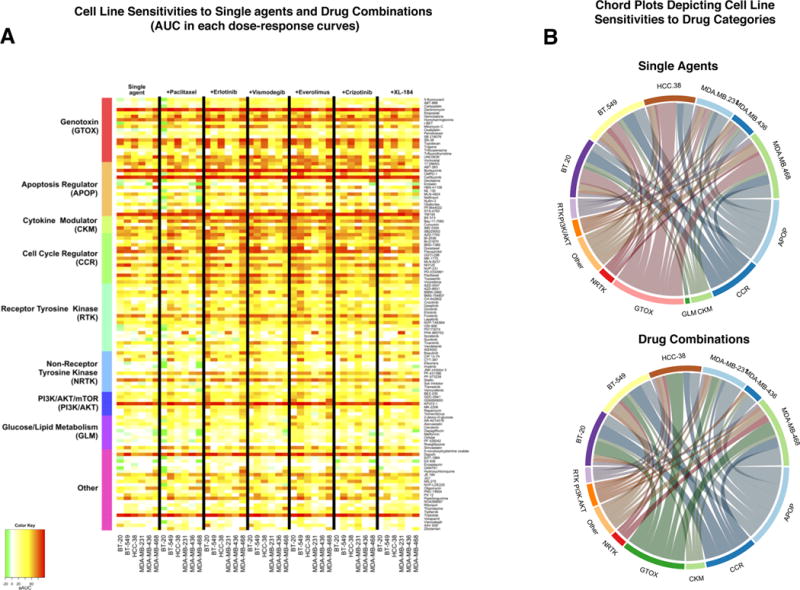
Figure 3.

Patterns of activity of drugs grouped in different categories across cell lines. A: Heatmap summarizing the results of MTS by the area under the curve (AUC) for each dose-response curve for single agents or pairwise drug combinations. AUC gives a single estimate of growth inhibition over multiple doses for each curve, with higher red color intensity indicating higher AUC. The first column set indicates response of six cell lines to 128 single agents (panel B) as rows, arranged in categories according to the drug’s target or mechanism of action. The subsequent six column-sets indicate growth inhibitory response when single agents are combined with either paclitaxel, everolimus, vismodegib, everolimus, crizotinib or XL-184 (panel A) respectively in the six TNBC cell lines. B: Chord plots display the drugs in each category that suppressed growth with AUC > 75% as single agents (top) or drug combinations (bottom) for each of the cell lines. In each chord plot, the upper semicircle reflects the relative sensitivities of cell lines toward various drug categories, while the lower semicircle reflects the relative efficacy of drug categories: circumference length indicates the number of drugs achieving AUC > 75% in that category.
