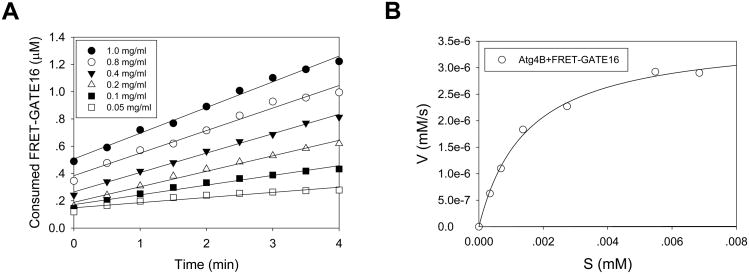
Figure 6. Determination of the kinetics of Atg4B toward GATE-16 using the FRET-based assay.
A. FRET-GATE-16 at different concentrations as indicated by the legends were incubated with 0.02 μg of Atg4B in a 20-μl volume. The consumed substrates were calculated and plotted against the incubation time. The first four minutes were used for initial velocity calculation, which was defined as the increment of the consumed substrate per second. B. The initial velocity (V, y-axis) was plotted against the concentration of the substrate (S [mM], x-axis). The curve was fitted using the ligand-binding method.

