

Abstract
Objective
The Centers for Disease Control and Prevention (CDC) created the Public Health Associate Program (PHAP) to establish a continuous source of public health professionals who can deliver frontline services at the federal, state, tribal, local, and territorial levels. The article describes preliminary evaluation findings for PHAP.
Design
The evaluation’s primary purposes are to assess the quality and effectiveness of PHAP, determine its value and impact, and provide information to continuously improve the program. Because the evaluation is both formative and summative and focuses on aggregate outputs and outcomes of PHAP, the methodology is complex and builds over time as different cohorts cycle into and out of the program. Results presented are outcomes of various Web-based surveys and reporting systems.
Participants
Four PHAP cohorts, consisting of 579 individuals, participated in 1 or more of the evaluation activities described in this article.
Results
The majority of participants report satisfaction with their PHAP experiences, and 74% of recent graduates indicate they are continuing their careers or education in public health immediately after program completion. Seventy-eight percent of recent PHAP graduates who accept a job in public health are employed by the federal government. One year post-PHAP, 74% of alumni report that PHAP has been influential in their careers.
Conclusion
CDC’s investment in PHAP has increased the capacity and capabilities of the public health workforce. Results presented are early indicators of program quality, effectiveness, and impact. Today’s public health workers are asked to do more with less, in the face of a dynamic array of complex public health challenges. PHAP offers public health agencies assistance in tackling these losses and challenges.
Keywords: program evaluation, public health, training evaluation, workforce development
A recent increase in the number of published articles describing the public health work-force has highlighted the need to develop and build the capacity and capability of the public health workforce.1–3 One strategy agencies use to ensure a workforce capable of meeting future public health needs is to recruit and develop the next generation of public health workers and leaders through on-the-job, service-learning4–7 programs and fellowships. These types of training programs embrace the principles of adult learning theory, providing trainees with hands-on learning experiences, instructional support, and mentoring while on assignment to public sector agencies and nonprofit organizations. For public health, service learning programs and fellowships hold the promise of increased system capacity and a pipeline of capable workers for the future.
Evaluation of these types of public health training programs is necessary to determine where they deliver on the promise and where they fall short; evaluation also guides program improvement efforts. Today’s focus on greater accountability, transparency,8 and evidence that demonstrates “what works” reinforces the importance of evaluation in planning and implementing public health workforce training programs.9 However, evaluation efforts can be cumbersome and costly for an agency10; they can often take years to plan, implement, and deliver results. Evaluating training programs can be particularly challenging, as there are unique methodological issues associated with measuring training outcomes and results.11–13 These issues include the distal nature of training outcomes, the number of confounding variables influencing the benefit and utility of training within an organization, and the lack of funding for, and experience in, training evaluation.11–13 As a result, many programs choose to employ basic monitoring techniques during the program14 and sometimes implement a more rigorous evaluation at the program’s end. However, in times of decreased federal budgets and increased scrutiny of use of federal funds, there is a need to provide evidence of program’s quality, effectiveness, and impact while the program is in progress.
The purpose of this article is to describe evaluation findings for the Public Health Associate Program (PHAP), a 2-year service learning program for early-career professionals.
Program Overview
The Centers for Disease Control and Prevention (CDC) created PHAP (originally named the Public Health Apprentice Program) in 2007 as a pilot program. The goal was to establish a continuous source of public health professionals who could deliver front-line services at the federal, state, tribal, local, and territorial levels.15 PHAP seeks to improve the capacity and capability of the public health workforce through recruitment, placement, and training of early-career professionals.
Once accepted into the program, participants, referred to as “associates,” work as CDC employees. Associates complete assignments in health departments or nonprofit organizations across the country, referred to as “host sites.”15 Since 2007, a total of 278 agencies have served as a host site. Assignments focus on public health program areas such as public health pre-paredness and response, tuberculosis elimination, and maternal and child health and are tailored to meet the unique needs of each host site.15
PHAP is competitive, and a large number of individuals apply each year. In 2014 and 2015 combined, 6275 applications were received. Since 2007, a total of 753 associates have been hired into PHAP through 8 cohorts. The cohorts, which are identified by the calendar year in which they enter the program, have increased in size over time; 208 associates were hired in 2015 compared with 10 in 2007.
Evaluation Strategy
In May 2014, a small team of training evaluators was assembled and planning for systematic program evaluation of PHAP commenced. A logic model16 was developed (see Figure 1) and the primary purposes of the evaluation were defined as follows: (1) assess PHAP’s quality and effectiveness; (2) determine PHAP’s value and impact; and (3) continuously inform and improve PHAP functioning. These elements informed the design of a comprehensive evaluation strategy that adheres to the steps and standards of the CDC Framework for Program Evaluation17 and combines elements of both formative and summative assessments. The primary evaluation questions addressed by the evaluation are mapped to the key components of the PHAP program logic model presented in Table 1. The evaluation strategy uses a prospective study design that coincides with the cyclical nature of a 2-year service learning program. As new data collection instruments are developed, piloted, and refined, they are integrated into the evaluation strategy as standard data collections for all cohorts.
FIGURE 1.

Public Health Associate Program: Logic Model
Abbreviations: CDC, Centers for Disease Control and Prevention; CDC CIOs, CDC Centers, Institutes, and Offices; PHAP, Public Health Associate Program; NGO, Nongovernmental organization; OSTLTS, Office for State, Tribal, Local and Territorial Support.
TABLE 1.
Public Health Associate Program: Key Program Logic Model Components, Associated Evaluation Questions, and Data Availability by Cohorta
| Program Logic Model Component | Associated Evaluation Questions |
|---|---|
| Program outputs | Is PHAP a quality program? |
| What is the cohort composition of associates? (PHAP 2013, 2014, 2015) | |
| What is the rate of attrition? (PHAP 2013, 2014, 2015) | |
| To what degree are associates satisfied with their experience? (PHAP 2013) | |
|
| |
| Immediate outcomes | Is PHAP effective? |
| Are graduates prepared for their next position? (PHAP 2013) | |
| How many job offers do graduates receive? (PHAP 2012, 2013) | |
| How many graduates are accepting jobs within the public health system immediately after PHAP? (PHAP 2012, 2013) | |
|
| |
| Immediate outcomes | What is the impact of PHAP? |
| Have alumni remained employed in the public health system? (PHAP 2012) | |
| How have alumni advanced in their position since graduation? (PHAP 2012) | |
| How has PHAP increased capacity and capability of the public health system? (PHAP 2012) | |
| Has PHAP influenced careers of alumni? (PHAP 2012) | |
Abbreviation: PHAP, Public Health Associate Program.
PHAP cohorts are identified by the calendar year in which they enter the program.
Methods
Given that the evaluation framework has been designed to be both formative and summative and focuses on aggregate outputs and outcomes of PHAP, the established methodology is complex and builds over time as different cohorts cycle into and out of the 2-year program. Results presented in the current article are outcomes of multiple Web-based surveys and reporting systems administered to 4 of 8 cohorts of associates over a 2-year period. See Table 1 for cohorts by evaluation question.
Participants
Associates from 4 of the most recent cohorts (2012–2015) were invited to participate in the evaluation (n = 579). This included the classes of 2012 (N = 100), 2013 (N = 134), 2014 (N = 142), and 2015 (N = 203).
Summary of measures and procedures
Data collection began in June 2014 and continued through April 2016. Methodological information, including respondents, instruments, and dates of administration, is provided for each collection method. Participation in all evaluation activities was voluntary, and results were kept secure to protect respondents’ privacy and confidentiality.
Welcome survey
The purpose was to collect demographic data from associates when they started the program. Participants were asked about their age, ethnicity, race, and highest academic degree obtained using questions modeled after US Census items.18 Three hundred thirty-two associates from the classes of 2014 and 2015 participated in the welcome survey (response rate = 96%).
Graduate disposition survey
The graduate disposition survey collected information about associates’ plans immediately after graduation from PHAP. The survey instrument had 41 total closed- and open-ended items related to post-PHAP disposition, including the number of job offers received. The survey used conditional branching; therefore, the actual number of items responded to by participants ranged from 6 to 26, depending on their specified plans after graduation (ie, employed associates were given the opportunity to respond to 17 disposition items, whereas those who were still looking for a job could respond to only 6 items). One hundred percent of graduates (N = 213) from the classes of 2012 and 2013 responded to the graduate disposition survey. The second iteration of the survey added 9 questions to assess graduates’ satisfaction with their PHAP experience. Associates from the class of 2013 were given the opportunity to respond to these questions; 108 of 113 responded (response rate = 96%).
Alumni disposition survey
The alumni disposition survey collected information about alumni careers and accomplishments 1 year after PHAP completion. The survey had 52 closed- and open-ended items related to alumni disposition and perceptions of program impact. The survey used conditional branching; therefore, the actual number of items participants responded to ranged from 6 to 29, depending on their career status (ie, employed alumni were given the opportunity to respond to 22 items, whereas alumni who were participating in a training or service program could respond to 8 items). Of the 100 alumni from the class of 2012 who were given the opportunity to participate in the alumni survey, 87 participated (response rate = 87%). The Office of Management and Budget (OMB) granted approval for this survey (OMB no. 0920-1078; expiration date: August 31, 2018).
CDC-maintained database
Select data from a CDC-maintained database were used to allow for the calculation of aggregate information from PHAP applicants and host sites. For this study, demographic information for the class of 2013 (n = 119) was extracted from the CDC Fellowship Management System (OMB no. 0920-0765; expiration date: April 30, 2018).
Data analysis
Quantitative data collected through the CDC database or the various electronic surveys were transferred separately into Microsoft Excel. Data from the 2 welcome surveys (n = 345), 2 graduate disposition surveys (n = 213), and alumni survey (n = 87) were analyzed independently. In addition, the class of 2012 graduate disposition survey was analyzed and compared with the class of 2012 alumni survey to show progression over time for the cohort. All data were coded, and descriptive statistical analyses were conducted. Missing data were excluded from analyses except where specifically indicated (eg, ethnic and racial composition of cohorts).
Results
Results are grouped by key logic model components and associated evaluation questions.
Program outputs: Is PHAP a quality program?
Cohort composition
Of the 479 associates enrolled in the PHAP classes of 2013, 2014, and 2015, demographic information was available for 451 associates (94%; demographic information was not collected from the PHAP class of 2012). The average age for the 3 cohorts was 26 years (range, 21–54 years). Thirty-nine percent of associates possessed an advanced academic degree (n = 145); however, the percentage of associates with advanced degrees increased over time (25% for the class of 2013 to 45% for the class of 2015). The percentage of associates who possessed a master’s of public health (MPH) degree also increased over time (13% for the class of 2013 to 33% for the class of 2015).
Of the 479 associates enrolled in the classes of 2013, 2014, and 2015, 8% identified as “Hispanic or Latino” (n = 38). The percentage of associates who identified as “Hispanic or Latino” increased over time (2% for the class of 2013 to 13% for the class of 2015). Forty-four percent of associates identified their race as “white” (n = 212), 33% as “black or African American”(n =161), 10% as “Asian”(n =47), 3% as “2 or more races” (n = 13), and 1% as “American Indian or Alaska Native” (n = 4). Nine percent of associates (n = 42) did not provide their race. See Figure 2 for cohort composition by racial category over time.
FIGURE 2.

Public Health Associate Program: Cohorts’ Composition by Race Over Time
Rate of attrition
Attrition is based on the number of associates who resign from PHAP more than 3 months before the end of the program. Rates of attrition have been calculated for 2 cohorts, the classes of 2013 and 2014. The rate of attrition for the class of 2013 was 11% (n = 15/134), with the majority of resignations (60%; n = 9/15) occurring within the first year of the 2-year assignment. The rate of attrition for the class of 2014 was 23% (n = 32/142). The timing of resignations for the class of 2014 was dispersed across the 2-year assignment period, with 41% of resignations (n = 13/32) occurring within the first year and 59% (n = 18/32) occurring during the second year.
Degree of satisfaction
Fifty-eight percent of respondents rated the overall quality of PHAP as “very good” or “excellent” (n = 59). An additional 31% rated the overall quality as “good” (n = 31). Seventy-four percent of respondents reported their public health skills increased “significantly” as a result of participating in PHAP (n = 79; see Table 2 for additional results).
TABLE 2.
Public Health Associate Program: Cohort Survey Ratings as Indicators of Program Quality and Effectiveness (PHAP 2013) and Impact (PHAP 2012)
| Survey Item | “Agree” and “Strongly Agree”a | ||
|---|---|---|---|
|
| |||
| % | n | ||
| Quality | Graduate would recommend host site to other associates | 93 | 97 |
| Graduate would recommend PHAP to others considering career in public health | 87 | 94 | |
|
| |||
| Effectiveness | Graduate feels prepared for next position as a result of PHAP | 84 | 91 |
| Graduate is serving as a public health ambassador | 86 | 86 | |
|
| |||
| Impact | Alumni would recommend PHAP to others considering career in public health (1 y post-PHAP) | 88 | 71 |
| Alumnus is serving as a public health ambassador (1 y post-PHAP) | 83 | 67 | |
Abbreviation: PHAP, Public Health Associate Program.
Scores ranged from “strongly disagree” to “strongly agree.” Results represent agreement response choices (ie, addition of “agree” and “strongly agree”).
Immediate outcomes: Is PHAP effective?
Job offers
Two cohorts received a total of 279 job offers: 118 job offers for the class of 2012 and 161 for the class of 2013. The average number of job offers for both classes was 1.4; job offers ranged from 0 to 6 per associate.
Disposition post-PHAP
Seventy-four percent of respondents across 2 cohorts reported that they were continuing their career or education in public health immediately after PHAP (n = 158); 12% were continuing their career or education in health care (n = 23). Fifty-three percent accepted a job in public health immediately after PHAP (n = 113). Two percent accepted a job in health care (n = 5). Seventy-eight percent of graduates who accepted a job reported working for the federal government (n = 89; see Figure 3 for breakdown by type of agency). Of these, 98% accepted employment with CDC (n = 86).
FIGURE 3.
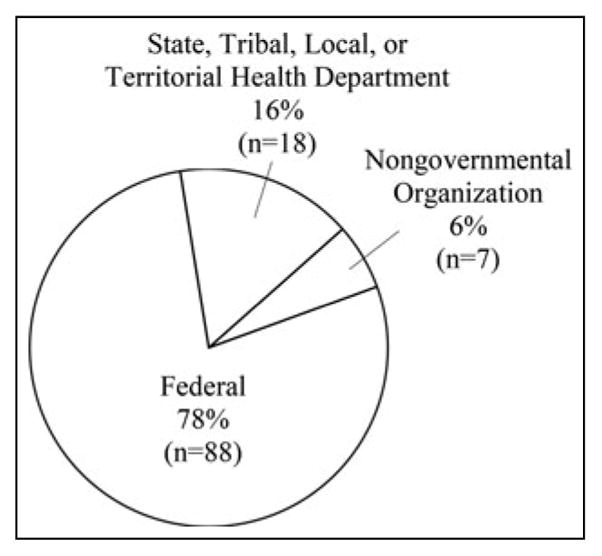
Public Health Associate Program: Disposition of Graduates Employed in Public Health
Of the associates who were furthering their education immediately after PHAP (n = 69), 67% were focusing on public health, 26% were focusing on health care, and 7% were focusing on a different field (eg, law).
Intermediate outcomes: What is the impact of PHAP?
Disposition 1 year post-PHAP
The percentage of alumni respondents who were employed (49%) or solely pursuing education (27%) 1 year postgraduation was comparable with the percentage of respondents who were employed or pursuing education at graduation (51% and 32%, respectively). From graduation to 1 year postgraduation, there was a 10% increase in respondents who were simultaneously employed and pursuing further education. The percentage of respondents looking for a job decreased by 15% from graduation to 1 year postgraduation. One year postgraduation, of the 16 respondents who were looking for a job or were undecided at the time of graduation, 9 were employed, 2 were pursuing further education, 1 was employed and pursuing education at the same time, and 1 was participating in a training program; 3 did not respond to the alumni survey.
One year postgraduation, 47 respondents were working in public health and 6 were working in health care. This includes 39 alumni who started working immediately after PHAP and 14 alumni who joined the workforce since. The majority of employed respondents continued to work for CDC (n = 28).
Position advancement
Alumni survey respondents reported holding varying degrees of responsibility in their jobs. Eighty-three percent of respondents reported that they led a project (n = 44), 26% reported that they led a team (n = 14), and 6% reported that they held an official supervisory position (n = 3). Consistent with salary ranges reported at graduation, the majority of respondents continued to earn between $50 000 and $69 000 per year. Forty-nine percent of respondents reported that they had advanced in their careers in the past year (n = 26). Fifty-three percent of respondents reported that they had received a salary increase (n = 28). Seventy-two percent reported having been given more responsibility in their jobs in the past year (n = 38).
Increased capacity and capability
A total of 113 associates from 2 cohorts joined the public health workforce immediately upon graduation (53%). In addition, alumni survey respondents reported supporting many public health topical areas. The most frequently supported areas of focus were chronic disease prevention, communicable disease control, and public health preparedness and response. In addition, alumni reported supporting all 10 essential public health services19,20 in varying capacities. The most frequent essential services supported were mobilizing community partnerships; informing, educating, and empowering people about health issues; and evaluating effectiveness, accessibility, and quality of health services.
Influence of PHAP
One year post-PHAP, 81% of alumni respondents reported interacting with their PHAP network “sometimes,” “often,” or “frequently” (n = 62). Seventy-four percent of respondents reported that PHAP has been “very” or “extremely” influential in their careers (n = 58; see Table 2 for additional results).
Limitations
All instruments used in the evaluation were based on self-report, and there was no observable counterfactual. In addition, given the evolving nature of the program and its evaluation, instruments and questions were added and modified over time. As a result, not all PHAP cohorts had the opportunity to respond to all data collection instruments. For example, the PHAP classes of 2012 and 2013 did not participate in the welcome survey, which was created in 2014.
Discussion
Overview of results
A key indicator of program quality is the composition of each PHAP cohort. To date, a large number of diverse individuals have been hired into PHAP, and the number continues to increase. Associates vary by age and race. The number of associates who possess an advanced degree, especially an MPH degree, has increased over the past 3 cohorts.
Associate attrition is an important component of program quality because it affects the size and composition of each cohort. The rate of attrition increased by 13% from the 2013 cohort to the 2014 cohort. While some associates offered explanations of why they were leaving the program early, such as an opportunity to pursue further education, the cause for the increase in attrition is unclear. Interestingly, when nonvoluntary terminations and attrition were combined to reflect the total number of associates leaving the program early, the difference between the 2013 and 2014 cohorts was reduced to 7%. This reduction is attributed to 6 nonvoluntary terminations within the 2013 cohort and none in the 2014 cohort. Further examination of nonvoluntary and voluntary separation patterns is needed to understand whether there is a relationship between attrition and nonvoluntary termination rates. Attrition and nonvoluntary termination rates will continue to be monitored in all subsequent cohorts; exit surveys are now used to identify the reasons associates are choosing to leave the program early.
Most public and private sector organizations use some form of customer satisfaction to assess the quality of products and services delivered. Associates are an important customer of PHAP. Overall, the associates are satisfied with the program; for example, the majority of associates would recommend PHAP to others considering a career in public health and indicate that PHAP prepared them for their next position. In addition, most associates would recommend their host site receive a future associate. This is a particularly strong indicator of program quality, given the program is designed as a service learning program.
One indicator of program effectiveness is associate retention in the public health system. In other words, do associates remain committed to public health after completing PHAP? Evidence suggests the answer to this question is yes. At the time of program completion, the vast majority (74%) of associates planned to continue their careers or education in public health. This finding alone is a strong indicator of the effectiveness of the program.
Alumni retention and career progression in public health are considered indicators of program impact. Results from the 1-year post-PHAP alumni survey were promising. The majority of alumni were employed or pursuing education in public health. The majority of those who were undecided or looking for a job at the time of PHAP graduation were working or furthering their education 1 year later. Alumni respondents who were employed reported career progression or advancement. The majority of these alumni reported that they have led a project, and a quarter reported having led a team. Alumni also reported that PHAP has been influential in their careers.
Moving forward: PHAP evaluation
On the basis of results from the 3 surveys described in this article, the PHAP evaluation is beginning to answer questions about the program’s quality, effectiveness, and impact. These surveys will continue to be deployed to all associates and alumni. The next phase of the evaluation will build on these core data collections and address more complex questions related to (a) the relationship among variables that may influence training program effectiveness, and (b) assessment of distal outcomes and program impact through monitoring career progression over time. Monitoring alumni retention and career progression in public health over time is particularly important because it serves as a proxy for the more distal PHAP outcome: a continuous pipeline of public health professionals capable of meeting public health workforce needs. Alumni career progression will be monitored 1, 3, and 5 years post-PHAP. Finally, the next phase of the evaluation will reach beyond associate and alumni perspectives and incorporate a new survey administered to all PHAP host site supervisors. Host site supervisors provide an important perspective that speaks directly to the impact of the program as a workforce capacity-building intervention. Host site supervisors also provide insight into the host site context and the factors that influence the PHAP benefit and utility to public health agencies.
Conclusion
CDC’s investment in PHAP thus far has resulted in an increase in the capacity and the capabilities of the public health workforce. The PHAP evaluation has established the capacity for basic workforce development program monitoring and analysis, including enrollment, attrition, and graduation rates while focusing on outcomes, including how participants progress in their careers beyond the program. As a result, early indicators of program quality, effectiveness, and impact have been used to refine and improve program design and delivery and provide accountability and transparency to PHAP stakeholders.
Implications for Policy & Practice.
Since 2008, the public health workforce has lost more than 50 600 state and local jobs, representing approximately 22% of the total state and local health department workforce.21
Today’s public health workers are asked to do more with less, in the face of a dynamic array of complex public health challenges, such as Ebola and Zika virus diseases. PHAP offers public health agencies assistance in tackling these losses and challenges.
As a pipeline program, PHAP addresses workforce shortages by placing early-career public health workers in public health agencies at no cost to the host agency and providing the public health system with a steady supply of well-trained graduates prepared for employment in federal, state, tribal, local, and territorial governmental public health agencies and nongovernmental public health organizations.
Acknowledgments
The Public Health Associate Program (PHAP) is supported by the Centers for Disease Control and Prevention (CDC). The authors thank all of the PHAP associates who participated in the evaluation activities. In addition, the authors thank CDC staff members working within PHAP and within the Applied Systems Research and Evaluation Branch for their guidance, feedback, and insight.
Footnotes
The findings and conclusions in this article are those of the authors and do not necessarily represent the official position of the Centers for Disease Control and Prevention.
The authors declare no conflicts of interest.
References
- 1.Novick LF, Moore JB, Hunter E, Baker EL. Public Health Workforce Interests and Needs Survey (PH WINS) J Public Health Manage Pract. 2015;21(S6, special suppl):S1–S174. [Google Scholar]
- 2.Beck AJ, Boulton ML, Coronado F. Enumeration of the governmental public health workforce, 2014. Am J Prev Med. 2014;47(5 suppl 3):S306–S313. doi: 10.1016/j.amepre.2014.07.018. [DOI] [PMC free article] [PubMed] [Google Scholar]
- 3.Dean HD, Myles RL, Spears-Jones C, Bishop-Cline A, Fenton KA. A strategic approach to public health workforce development and capacity building. Am J Prev Med. 2014;47(5 suppl 3):S288–S296. doi: 10.1016/j.amepre.2014.07.016. [DOI] [PubMed] [Google Scholar]
- 4.Cashman SB, Seifer SD. Service-learning: an integral part of undergraduate public health. Am J Prev Med. 2008;35(3):273–278. doi: 10.1016/j.amepre.2008.06.012. [DOI] [PubMed] [Google Scholar]
- 5.Borzak L, editor. Field Study: A Source Book for Experiential Learning. Beverly Hills, CA: Sage Publications; 1981. [Google Scholar]
- 6.Furco A. Service-learning: a balance approach to experiential education. In: Taylor B, editor. Expanding Boundaries: Service and Learning. Vol. 1. Washington, DC: Corporation for National Service; 1996. pp. 2–6. [Google Scholar]
- 7.Thacker SB, Koo D, Delany JR. Career paths to public health: programs at the Centers for Disease Control and Prevention. Am J Prev Med. 2008;35(3):279–283. doi: 10.1016/j.amepre.2008.06.020. [DOI] [PubMed] [Google Scholar]
- 8.Schweigert FJ. The meaning of effectiveness in assessing community initiatives. Am J Eval. 2006;27(4):416–436. [Google Scholar]
- 9.Potter MA, Ley CE, Fertman CI, Eggleston MM, Duman S. Evaluating workforce development: perspectives, processes, and lessons learned. J Public Health Manag Pract. 2003;9(6):489–495. doi: 10.1097/00124784-200311000-00008. [DOI] [PubMed] [Google Scholar]
- 10.Sobelson RK, Young AC. Evaluation of a federally funded workforce development program: the Centers for Public Health Preparedness. Eval Program Plann. 2013;37:50–57. doi: 10.1016/j.evalprogplan.2013.01.001. [DOI] [PMC free article] [PubMed] [Google Scholar]
- 11.Medina L, Acosta-Perez E, Velez C, et al. Training and capacity building evaluation: maximizing resources and results with Success Case Method. Eval Program Plann. 2015;52:126–132. doi: 10.1016/j.evalprogplan.2015.03.008. [DOI] [PMC free article] [PubMed] [Google Scholar]
- 12.O’Malley G, Thomas P, Petracca F. A framework for outcome-level evaluation of in-service training of health care workers. Human Re-sour Health. 2013;11:50. doi: 10.1186/1478-4491-11-50. [DOI] [PMC free article] [PubMed] [Google Scholar]
- 13.Dionne P. The evaluation of training activities: a complex issue involving different stakes. Human Resour Dev Q. 1996 Fall;:279–286. [Google Scholar]
- 14.Youtie J, Corley EA. Federally sponsored multidisciplinary research centers: learning, evaluation, and vicious circles. Eval Program Plann. 2011;34:13–20. doi: 10.1016/j.evalprogplan.2010.05.002. [DOI] [PubMed] [Google Scholar]
- 15.Meyer PA, Brusuelas KM, Baden DJ, Duncan HL. Training public health advisors. J Public Health Manag Pract. 2015;21(6):E19–E22. doi: 10.1097/PHH.0000000000000214. [DOI] [PMC free article] [PubMed] [Google Scholar]
- 16.McLaughlin JA, Jordan GB. Logic models: a tool for telling your program’s performance story. Eval Program Plann. 1999;22(1):65–72. [Google Scholar]
- 17.Centers for Disease Control and Prevention. Framework for Program Evaluation in public health. MMWR Recomm Rep. 1999;48(RR-11):1–40. [PubMed] [Google Scholar]
- 18.United States Census Bureau. [Accessed July 7, 2016];About Hispanic origin and race. http://www.census.gov/topics/population/hispanic-origin/about.html and http://www.census.gov/topics/population/race/about.html.
- 19.Institute of Medicine. The Future of Public Health. Washington, DC: Institute of Medicine; 1988. [Google Scholar]
- 20.Centers for Disease Control and Prevention. National Public Health Performance Standards Program. Core Public Health Functions Steering Committee. Ten essential public health services; [Accessed June 27, 2016]. http://www.cdc.gov/nphpsp/essentialservices.html. [Google Scholar]
- 21.Drehoble P, Stower HG, Koo D. On the road to a stronger public health workforce. Am J Prev Med. 2014;47(5 suppl 3):S280–S285. doi: 10.1016/j.amepre.2014.07.013. [DOI] [PubMed] [Google Scholar]