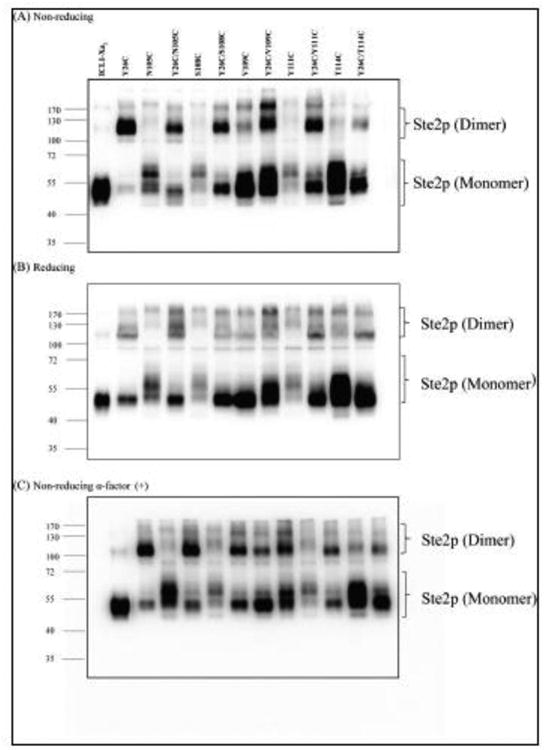
Figure 4.

(A) Ste2p expression levels of various Cys mutants. Total membranes from cells expressing various mutants were prepared as described in Materials and Methods. The membrane preparations were fractionated by SDS-PAGE under non-reducing conditions; the gel was blotted and probed using antibody against the C-terminal FLAG epitope tag to detect the presence of Ste2p at either the monomer or dimer positions, (B) Effect of reducing agent (β-mercaptoethanol) on dimerization. (C) Effect of ligand binding on dimerization. Membranes were incubated with α-factor (1μM final concentration) prior to SDS-PAGE gel under non-reducing conditions and immunoblotting. Molecular mass markers (kDa) are indicated on the left-hand side. Blots were overexposed to be able to see the mutants. Blots with shorter exposure time were used for accurate quantification of Ste2p band intensity (Fig. 5).
