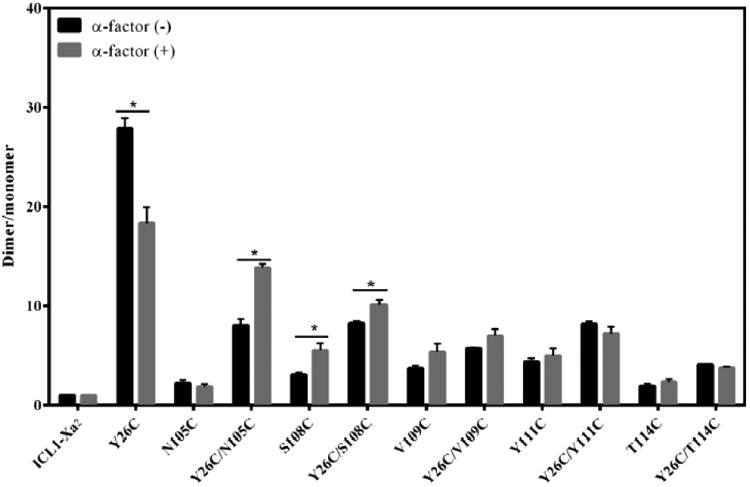
Figure 5.

Effect of ligand binding on dimerization. Band intensity of dimer and monomer forms of Ste2p was quantified from Western blots (Figs. 4A & C) using Image Lab (version 4.1). The dimer/monomer ratio of the mutants was normalized to that of the ICL1-Xa2 (Labeled F-H-Xa in figure for Flag-His-Xa2 receptor). Black and grey bars represent the ratio of dimer to monomer in the absence or presence of α-factor, respectively. Statistical significance (p<0.05) in the dimer-monomer ratio is indicated by an asterisk.
