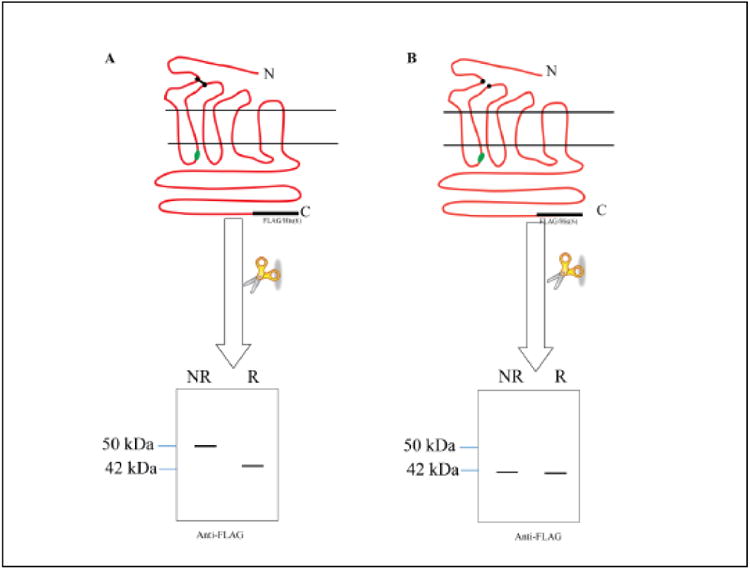
Figure 6.

Diagram showing the predicted SDS-PAGE profile of Ste2p with and without disulfide crosslinking between the N-terminus and ECL1 after Factor Xa digestion as detected by immunoblot using antibody against the C-terminal FLAG epitope. Non-reducing and reducing conditions of the sample buffer are indicated by NR and R, respectively. The immunoblot on the left (A) shows the result of crosslinking between ECL1 and the N-terminus. The diagram of immunoblot on the right (B) would result from no N-terminal-ECL1 crosslinking. The N and C-termini of Ste2p are indicated by N and C, respectively. The XX in ICL1 indicates the location of the protease Factor Xa cleavage site. The FLAG and His epitope tags are shown in black.
