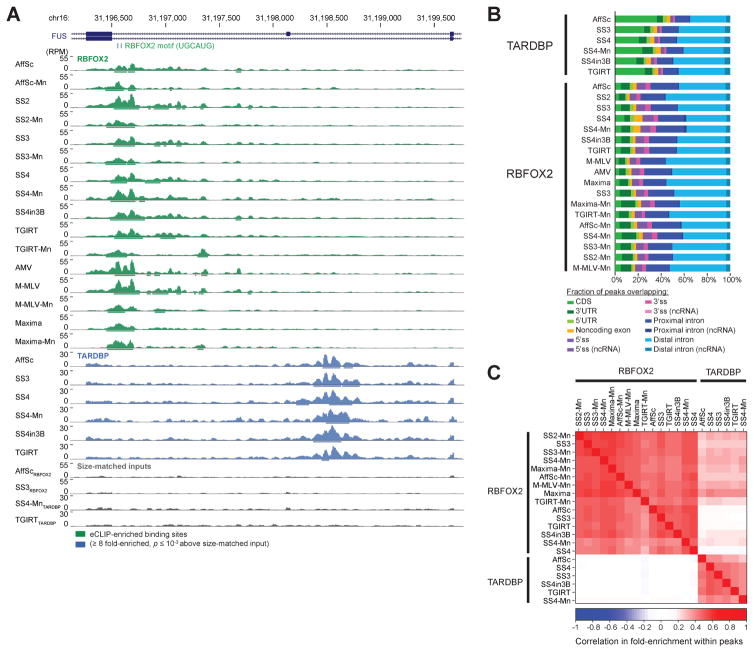
Figure 2. eCLIP yields similar binding profiles with different reverse transcription conditions.
(A) Genome browser depiction of RBFOX2, TARDBP, and selected paired size-matched input eCLIP read density for exons 6–8 of FUS, with eCLIP performed with indicated reverse transcription conditions (abbreviated as in Fig. 1C). Read densities are shown as reads per million (RPM). Significantly enriched peaks are displayed as bars below read density tracks. (B) Bars indicate the cumulative fraction of significantly enriched peaks overlapping the indicated regions of annotated transcripts. (C) Color indicates Pearson correlation (R) between IP versus input fold-enrichment in in peaks for pair-wise comparison of eCLIP experiments, based on the peak list for the dataset indicated on the x-axis. Shown are all datasets with independent paired size-matched inputs.

