
Figure 8. Characteristics of ribosome footprints.
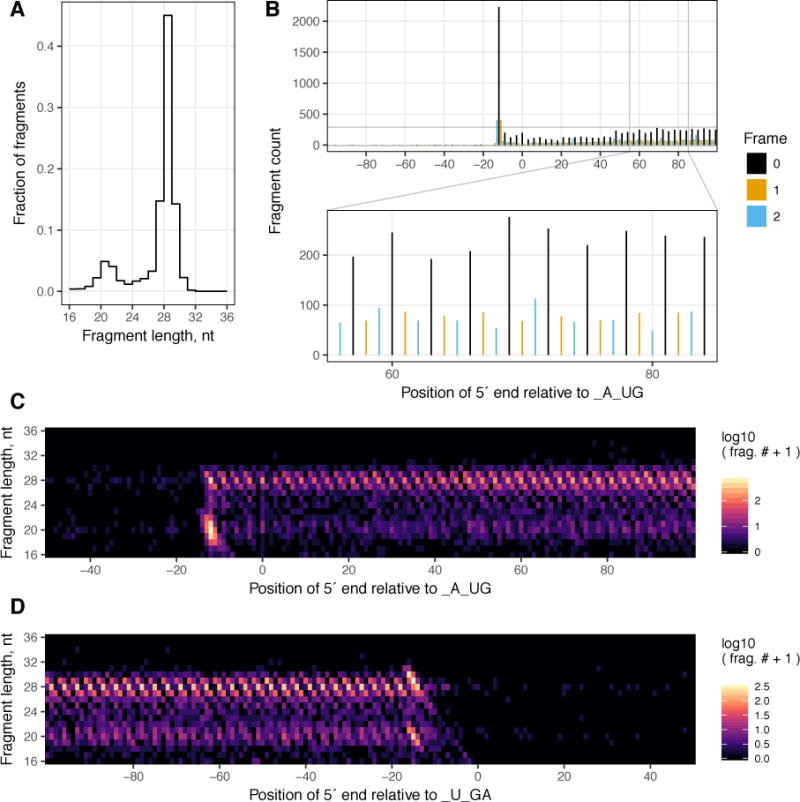
All panels are based on the analysis of a single sample from the described library (barcode ATCGT), prepared from wild-type S. cerevisiae BY4742 grown to OD600 0.6 in YEPD. A The frequency distribution of fragment lengths between 16 – 36 nucleotides (nt). B A meta-gene plot of fragments of all lengths whose 5′ end aligns within 100 nt of the start codon. The height of each bar represents the number of fragment 5′ ends aligning to a given nucleotide position. The color of the bar represents the frame of that nucleotide relative to the A in the AUG start codon. The lower panel illustrates the portion 55 – 85 nt after the start codon with greater resolution. C & D are heatmaps illustrating the log10 of the number of fragment 5′ ends (after the addition of a pseudo count of 1) of each fragment length at each nucleotide around the start codon (C) and stop codon (D).