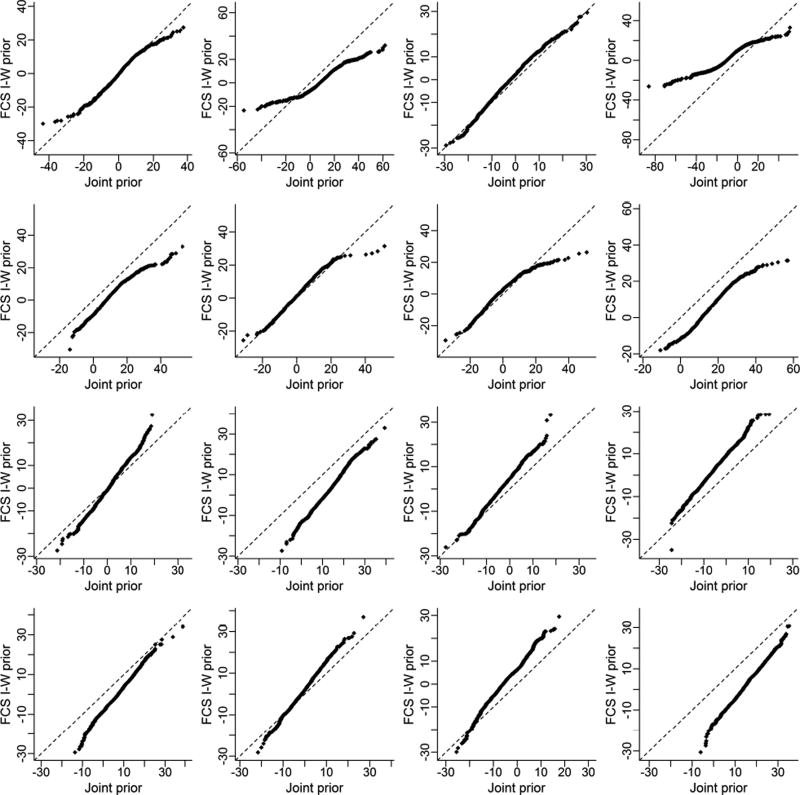
Figure 3.
Quantile quantile plots for the joint and MICE-IW predictive distributions for selected individuals Yij. Row 1: n=10, m=5; Row 2: n=30, m=5; Row 3: n = 10, m = 30; Row 4: n=30, m = 30. Ψ takes the same values as in Figure 1 with ρ = .85. Σ is the matrix used in Figure 1 with correlation 0.65, but scaled by 1/1.75.

