Figure 5.
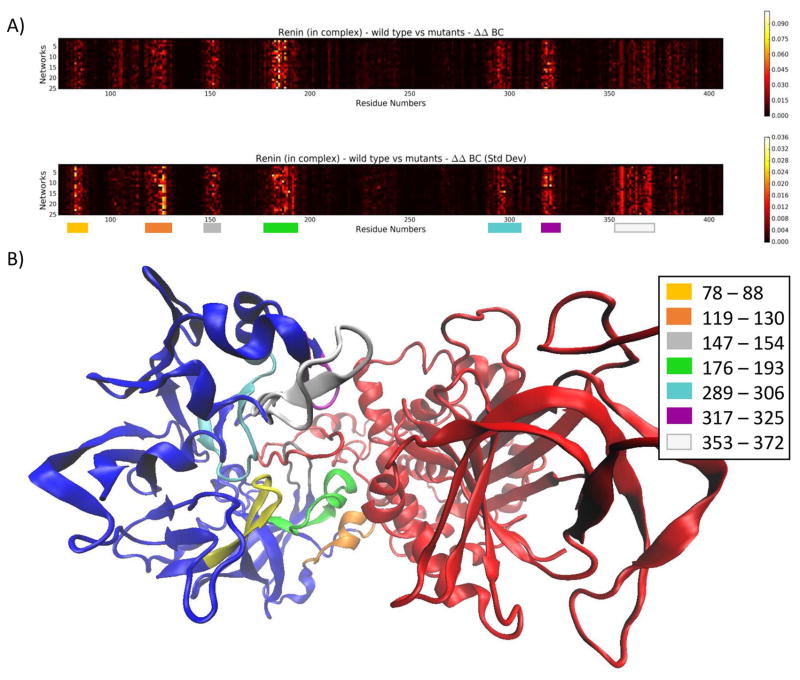
A) A heat map depicting the absolute difference between ΔBC in the wild type (first row) and ΔBC in the mutants (ΔΔBC) in chain A (renin) of the complex. Most differences are confined to the color-coded regions. B) The renin-angiotensinogen complex. The areas consisting of large changes in BC in renin (red) have been mapped to the structure.

