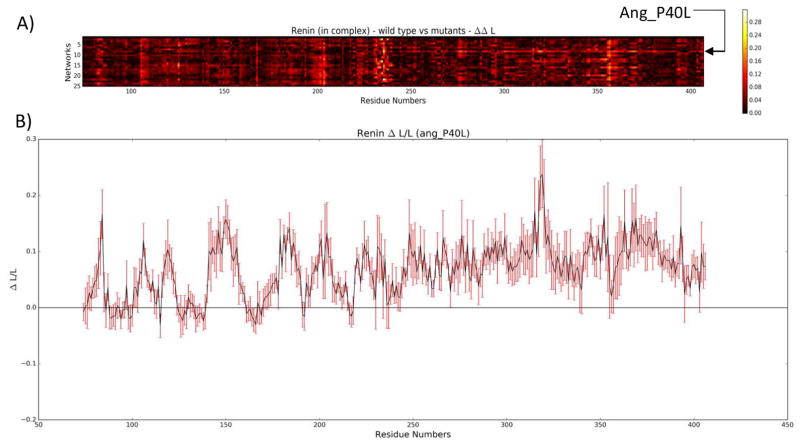
Figure 7.
A) Heat map representing the absolute difference in ΔL/L between the wild type renin and the mutants. The mutant complex, ang_P40L, stands out from residue 245 until the end of renin. B) Closer inspection of ang_P40L shows an elevated ΔL/L for the later part of renin, while the standard deviation, depicted by the red error bars, remains relatively small.

