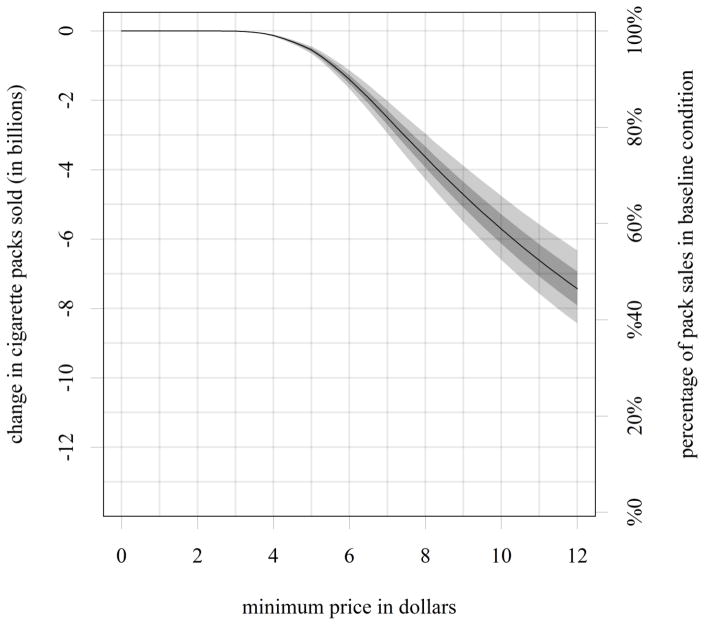
Figure 2.
Expected change in packs sold nationally under various minimum price scenarios. The plot includes 68% (inner dark gray) and 95% (outer light gray) confidence intervals. The right axis identifies the percentage of sales in the baseline no-minimum-price scenario that remain in the minimum price scenario represented on the X-axis.

