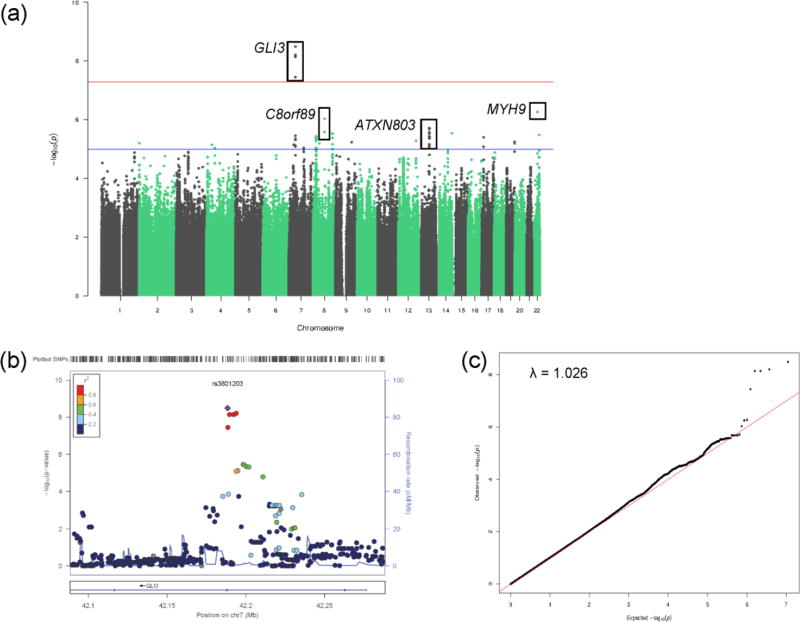
Figure 2.
Manhattan, regional association, and quantile-quantile plots for GWAS of language performance. (a) Observed –log10 p-values (y-axis) are displayed for all tested SNPs on each chromosome (x-axis). A SNP was considered genome-wide significant if p < 5 × 10⁻⁸ (above red line). Suggestive SNP associations were identified as those reaching genome-wide significance of p < 1 × 10⁻⁵ (above blue line). (b) Regional association plot showing the region around the most significant SNP in the GWAS. The SNPs within 500 kb of rs3801203 are plotted as their GWAS −log10 P-values against their NCBI 37 genomic position. The blue line indicates recombination rates estimated from the 1000 Genomes Project reference data. The color scale of r2 values is used to label SNPs based on their correlation with rs3801203. (c) The genomic inflation factor (λ) was 1.026 suggesting no population stratification effect.

