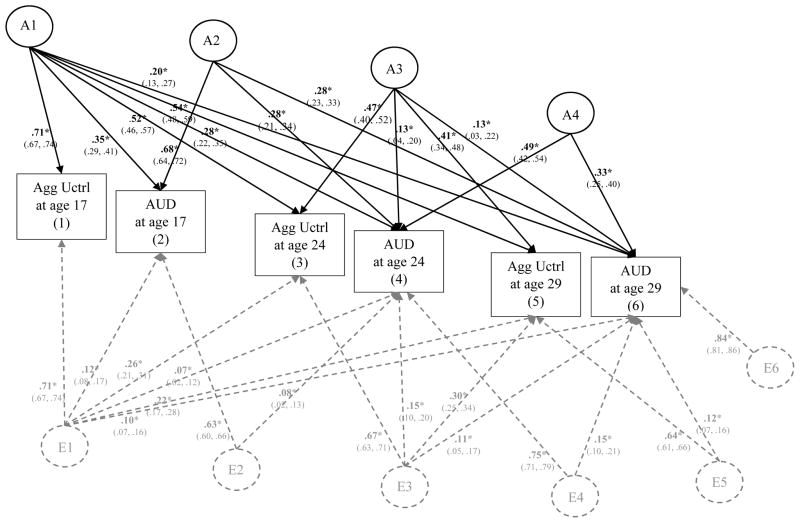
Figure 9. Genetic and Environmental Influences on Aggressive Undercontrol (Agg Uctrl) and Alcohol Use Disorder (AUD) Symptoms from Age 17 to Age 29.
This figure illustrates the most parsimonious model (Δχ2 = 34.08 on 31 df change, p = .32). Results from the full model are provided in the supplementary materials (eFigure 9). Variance of each phenotype is decomposed into additive genetic effects (A1, A2, A3, A4, A5, A6) and nonshared environmental effects (E1, E2, E3, E4, E5, E6); all shared environmental effects (and corresponding C paths) were not significantly different than zero and thus dropped in this more parsimonious model. For clarity of presentation, A labels and paths are shown in black and E paths and labels are shown in dashed gray. Significance is denoted by * p < .05 and bolded coefficients. Paths can be squared and summed to determine the total proportion of A and E variance explained. For example, to determine the proportion of A variance explained in AUD at age 29 by aggressive undercontrol at age 17, path a61 (.20) would be squared then divided by all the squared and summed paths leading to Age 29 AUD (.202/.202+.282+.132+.332); thus confirming that ~16% of the total predicted additive genetic influence on AUD at age 29 can be explained by aggressive undercontrol at age 17.

