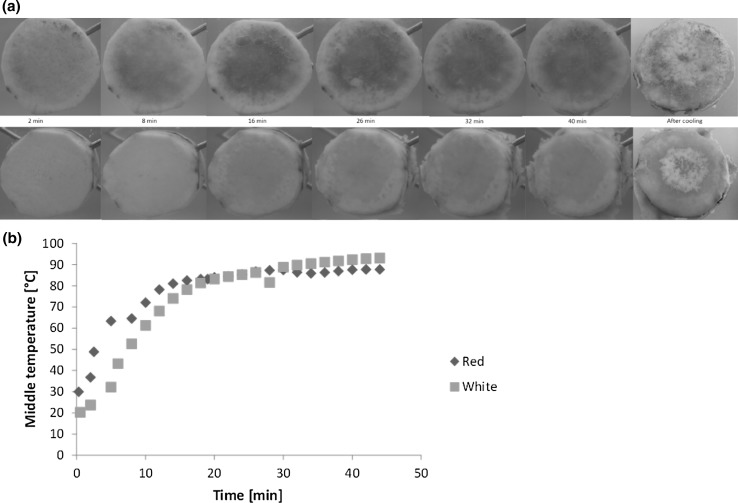
Fig. 1.
a Typical visual changes in red and white varieties of Xanthosoma sagittifolium roots during cooking. b Temperature profile of red and white varieties of Xanthosoma sagittifolium roots during cooking. The plot represents the mean temperature (°C) in the middle of the root samples (n = 3 for each variety), as affected by cooking time in 93 ± 4 °C hot water (colour figure online)

