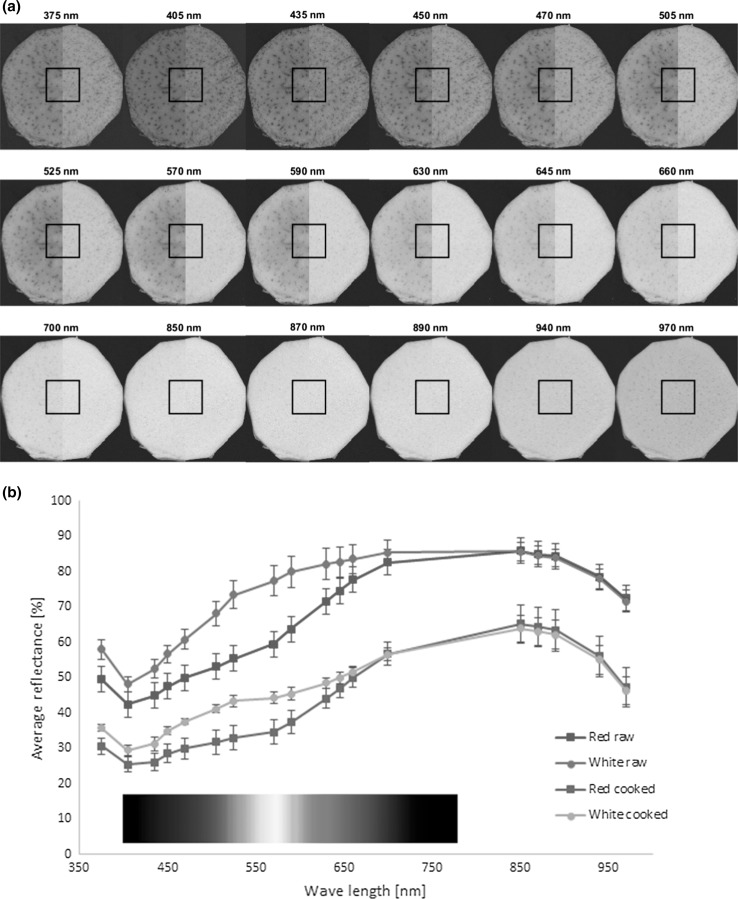
Fig. 2.
a Typical multispectral images of red (left half) and white (right half) varieties of Xanthosoma sagittifolium roots at each of the investigated spectral wavelengths. Average reflectance spectra from the square region in the center of each cocoyam sample were used for spectral analysis. b Average multispectral reflectance of raw and cooked roots of the red and white varieties of Xanthosoma sagittifolium (n = 10 for each variety) (colour figure online)

