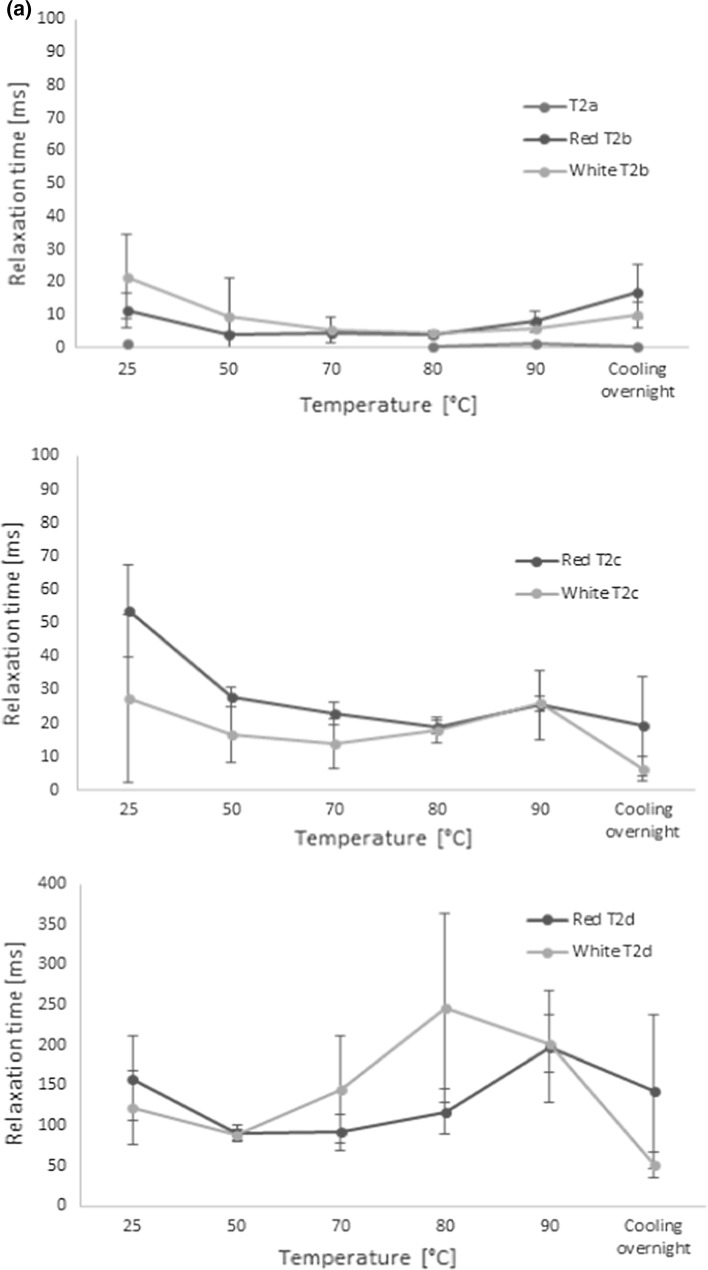
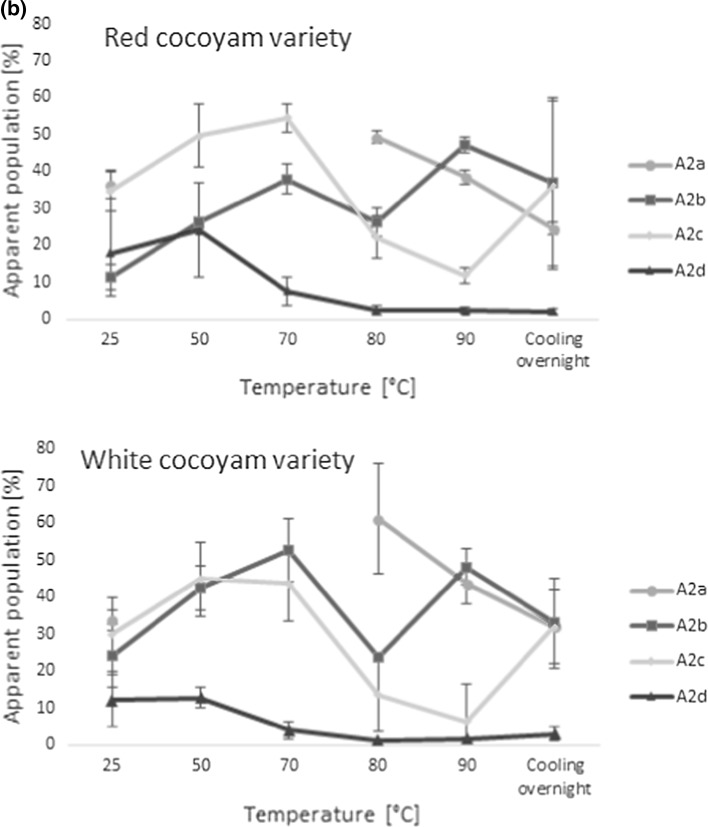
Fig. 3.
Mean transverse relaxation times (a) and their representative apparent water populations (b) of cocoyam roots as a function of cooking temperature (n = 10 for each variety). The T2 relaxation times were estimated by discrete exponential fitting of LF-NMR CPMG relaxation curves of the test samples at each temperature


