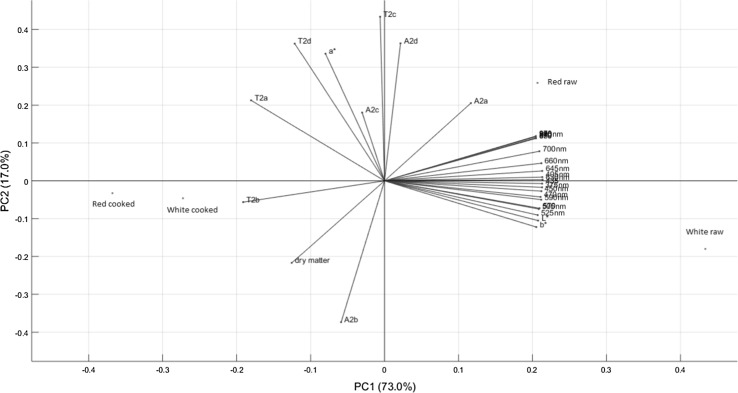
Fig. 5.
Principal component analysis (PCA) bi-plot of scores and loadings on all tested variables, for raw and cooked roots of the red and white varieties of Xanthosoma saggitifolium. The uniaxial compression data was excluded from the PCA, since only data from the raw roots was available for this analytical technique (colour figure online)

