
Figure 6.
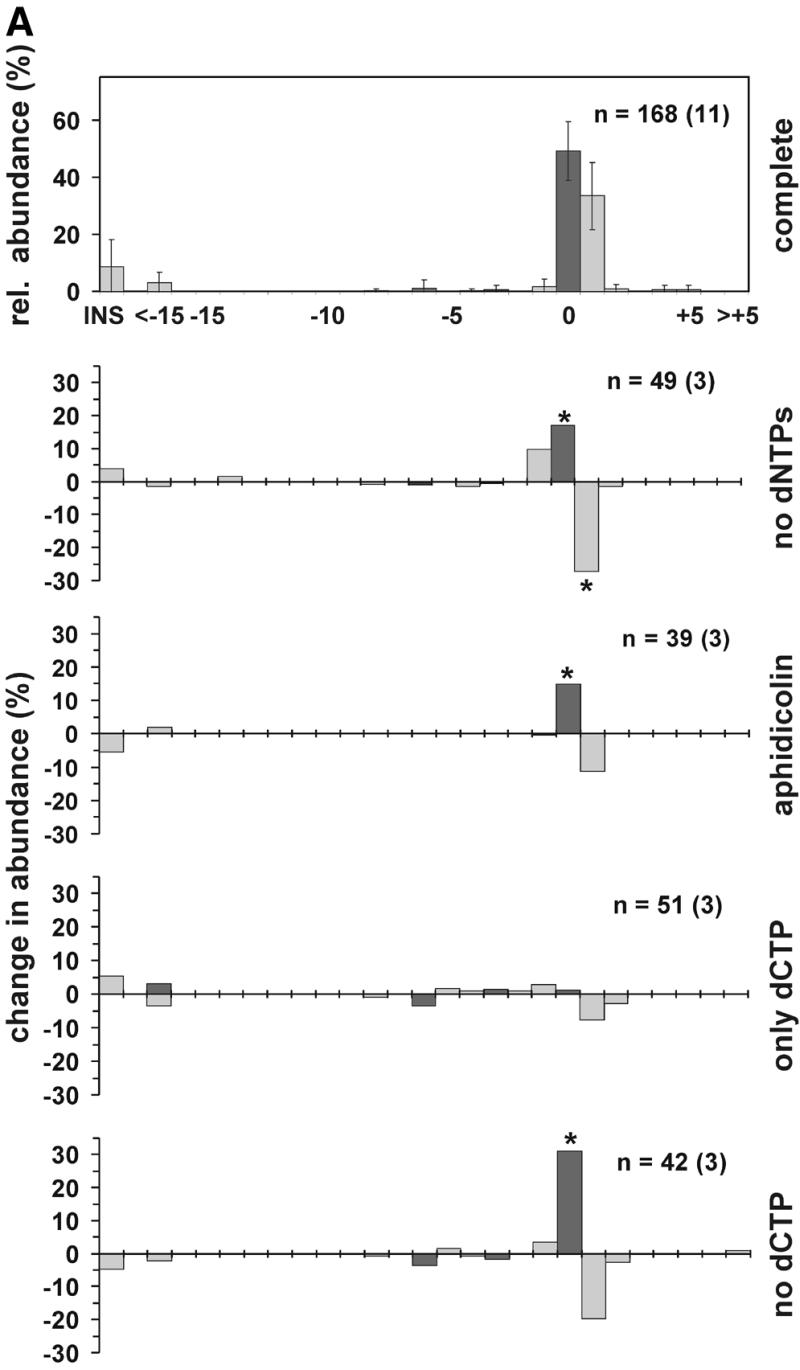

The effect of DNA repair synthesis on the distribution of NHEJ products. (A) DSB substrate XM was incubated with HeLa whole cell extract as described in Materials and Methods. After end joining, the reaction substrate DNA was recovered and transfected into E.coli to assess the formation of circular monomeric end joining products as described in Materials and Methods. The DNA sequence at the break site was determined for an appropriate number of products giving rise to white and blue plaques. The abundance of a particular NHEJ product was then determined as a fraction of this product configuration among the blue or white plaques. The NHEJ products are shown as a distribution of product length and marked in black or gray, corresponding to blue or white plaque phenotype, respectively. The topmost panel presents the relative abundance of end joining products in the complete reaction, the error bar indicating the standard deviation. Lower panels indicate the change in abundance of end joining products when compared to the complete reaction and in response to omission or inclusion of compounds as shown on the right. Aphidicolin was present at 60 ng/µl. n, number of individual products analyzed. The numbers in independent experiments are indicated in parentheses. Statistically significant changes (P < 0.05, unpaired Student’s t-test) in product distribution, when compared with the complete reaction, are indicated by an asterisk. (B) The diagram presents the most abundant configurations of NHEJ joining intermediates representing different repair modes. See text for more details.