Abstract
Epigallocatechin gallate (EGCG) and flavonols are important phenolic compounds in green tea. These compounds are sensitive to thermal condition and their structural alteration results in making browning the green tea infusion. This study aimed to research the interaction between EGCG and flavonols during thermal infusion. EGCG and flavonols model solutions were prepared based on concentration in green tea infusion, and their colors appearance and attributes were analyzed in 10 h by thermal treatment. Results showed that kaempferol, quercetin, and myricetin accelerated the oxidation of EGCG and made the model solution browning. HPLC analysis revealed there was an obvious shift of a broaden peak in the mixed model solution of EGCG and flavonols after thermal treatment. This broaden peak was further purified on HPLC and solid phase extraction methods to yield colored complexes. The complexes showed the maximal absorption around 424, 442, and 482 nm. MS/MS analysis revealed that the complexes possessed of three components those were consisted of the interaction between EGCG and myricetin. These results indicated that the interaction between EGCG and flavonols might form complexes during thermal treatment, The complexes were contributed to make green tea infusion browning.
Keywords: Color, EGCG, Flavonols, Thermal treatment, Colored complexes
Introduction
Green tea has been a particular interest in the field of food and nutritional sciences since it has been confirmed to possess multiple beneficial properties to human health (Wang et al. 2008). The quality and consumer acceptability of green tea is primarily determined by its color attributes. Light, temperature, and pH condition affect the color of green tea infusion by shifting its color from bright green to yellowish/brown, which lowers its quality (Wang et al. 2004). It has been confirmed that catechins are the essential compounds those cause the color alteration of green tea infusion (Liang et al. 2008; Wang et al. 2000). For example, epigallocatechin gallate (EGCG), as a major colorless catechin in tea, can be easily oxidized to yield dimers and quinones when exposure to oxygen during green tea infusion process, leading to the tea color alteration (Liu et al. 2010; Neilson et al. 2007; Sang et al. 2005; Bazinet et al. 2010; Xu et al. 2003). In addition, flavonols and flavonol glycosides also play important roles in determining the color appearance of green tea infusion although their content much less than tea catechins (Price et al. 1998; Wu et al. 2012; Helliwell 2001). Hydrolysis of flavonol glycosides takes place during green tea infusion, results in forming flavonols (Hughes et al. 1998). Both flavonol glycosides and flavonols have been reported to undergo polymerization and form larger molecular pigments, leading green tea infusion to a yellowish color shift (Tsanova-Savova and Ribarova 2002; Roberts et al. 1956).
Browning has been got a great concern because it negatively affects the appearance of green tea infusion (Zhang et al. 2015). It has been well documented that oxidation and degradation of tea catechins play important roles in browning of green tea infusion (Xie et al. 1993; Wang and Helliwell 2000). The mechanism of green tea browning is very complex, and a large amount works have been done to explore the mechanism of browning (Kumar et al. 2011). The majority of results indicate that the oxidation of catechins is the main factor. On the other hand, our previous research found that not only oxidation of EGCG could change the tea infusion color, but other compounds such as flavonols and l-cysteine also could affect browning through interaction. However, the compounds in tea infusion are very complicated and difficult to separate and purify directly, we have to choose some standard substances to simulate green tea infusion to explain the mechanism. Therefore, we prepared EGCG and flavonols mixed model solutions in this study and researched their color alteration after thermal treatments. In addition, the colored complexes formed in the model solutions which were purified through the chromatography method, and characterized by Ultraviolet–Visible (UV) and mass spectrometry (MS/MS) approaches. This study could bring significant knowledge on the interactive between catechins and flanovols in browning of green tea infusion, and the findings in this study could provide useful information on quality control of green tea infusion.
Materials and methods
Chemicals and reagent
(–)-Epigallocatechin gallate (EGCG) was purchased from Sangon-Biotech Chemical Co., Ltd. (Shanghai, China). Gallocatechin gallate, gallic acid, kaempferol, quercetin, and myricetin were purchased from Sigma-Aldrich Chemical Co., Ltd. (St. Louis, MO, USA). All standards have a purity above 98%. HPLC grade methanol, acetonitrile, and acetic acid were purchased from Tedia Co., Ltd (Fairfield, OH, USA). The other chemicals were purchased from Sinopharm Chemical Reagent Co., Ltd. (Shanghai, China).
Sample preparation and thermal treatment
The model solution of EGCG and flavonols were prepared according to an exact concentration in green tea infusion (Jiang et al. 2013, 2015). Briefly, 1.45 mM EGCG was mixed with 0.14 mM kaempferol (E + K), 0.17 mM quercetin (E + Q), or 0.11 mM myricetin (E + M) in 0.2 mol/L phosphate buffer (pH 5.0) by an ultrasonic bath (KQ-500D; Kunshan, China). Four control solutions included 1.45 mM EGCG, 0.14 mM kaempferol, 0.17 mM quercetin, and 0.11 mM myricetin in 0.2 mol/L phosphate buffer (pH 5.0). These model solutions were heated in a 100 °C water bath for 0, 1, 2, 4, 6, 8, and 10 h. Then let them cool in room temperature, the model solutions were immediately sealed and frozen at −20 °C before a further analysis.
Color analysis
The model solution after the thermal treatment was measured by a digital camera to visualize their color appearance. Meanwhile, the color attributes of the model solution, including L* (brightness), a* (redness), and b* (yellowness), were analysis by a Chromatic meter (Konica Minolta, Japan) and using by Color Companion Software. The total color change (ΔE) and browning index (BI) of these solutions were analysed according to the published methods (Li et al. 2013; Sommano et al. 2011):
L*t, a*t and b*t as above represented the variable as brightness, redness, and yellowness at time ‘t’, and L*0, a*0 and b*0 were the variable as brightness, redness, and yellowness at time ‘0’.
The UV analysis of the model solution after 0, 1, 2, 4, 6, 8, and 10 h of the thermal treatment was measured at a wavelength range in 200–600 nm on an Ultraviolet–Visible (UV) Spectrum (Beckmann UV 730, Germany). The phosphate buffer (0.2 mol/L, pH 5.0) was used as the blank.
HPLC–UV/Visible analysis
After the thermal treatment, the model solution was analyzed by a high performance liquid chromatography (HPLC) system coupled with an UV/visible detector (Waters Corporation, Milford, MA). A Phenomenex Synergi C18 reversed-phase column (250 × 4.6 mm, 4 µm, Phenomenex, Torrance, CA, USA) was used for the compound separation under a flow rate of 1.0 mL/min. The mobile phase consisted of (A) water containing 1.0% acetic acid and (B) 100% acetonitrile. The gradient was programmed as below: 0–5 min, 10 –15% B; 5–15 min, 15–40% B; 15–20 min, 40–60% B; 20–25 min 60–80% B; 25–30 min 80–100% B; 30–45 min 100–10% B; and 50 min at 10% B. The model solution was centrifuged at 12,000 rpm for 10 min before injecting and the injection volume was set at 5 µL. The column was maintained at 30 °C, and the detection wavelength was set at 280, 350 and 480 nm to detect catechins, flavonols, and colored complexes respectively. The data were recorded and analyzed from 0 to 35 min.
Purification of colored complexes
The E + M model solution was selected for the analysis of colored complexes in this study. Briefly, the E + M model solution after 10 h in thermal treatment was cooled to the room temperature. Afterwards, the model solution was injected onto HPLC system based on the ingredient program as mentioned in HPLC–UV/Vis analysis section. The fraction of the colored complexes was collected in its retention time on the column. The collected fraction was immediately freeze-dried to yield the raw color complex powder. Subsequently, the freeze-dried color complex powder (0.2 g) was dissolved in 1 mL of methanol: hydrochloric acid (99:1, v/v), and centrifuged at 12,000 rpm for 10 min to collect the supernatant. Subsequently, the supernatant (1 mL) was loaded onto a SEP-PAK C18 solid phase extraction (3 cc/500 mg, Waters, Milford, MA, USA) and pre-conditioned by 10 mL of methanol. Phosphate and small molecular substances were removed by 4 mL of distilled water. The colored complexes were cleaned by 2 mL of methanol. Finally, the purified colored complexes were dried on a nitrogen stream.
Characterization of colored complexes (UV analysis)
The purified colored complexes (2 mg) were dissolved into 2 mL of methanol to yield the solution of the colored complexes. The resultant solution was scanned at a wavelength range in 200–800 nm on an Ultraviolet–Visible (UV) Spectrum (Beckmann UV 730, Germany) to observe its maximal absorption peaks.
Characterization of colored complexes (UPLC–MS/MS analysis)
An ultra-performance liquid chromatography (UPLC) and an Agilent QQQ Mass Spectrometer (Agilent Technologies, Palo Alto, CA, USA) were used for analyzing colored complexes. The injection volume was 5 µL and the flow rate was set at 0.4 mL/min. The mobile phase consisted of (A) 0.1% acetic acid in water and (B) 100% acetonitrile. Mass spectrum was acquired by the electrospray ionization in a negative mode with the capillary voltage of 175 V. Mass scan range was set from m/z 100 to 2000. Drying gas temperature in 325 °C, drying gas of 12 L/min, and nebulizer pressure of 25–35 psi was performed.
Statistical analysis
Data were expressed as the mean ± standard deviation by three replicate tests. All figures were drafted by Graph Pad Prism 5 (GraphPad Software, La Jolla, CA, USA), Origin Pro8 (Origin Lab Corp., Northampton, MA, USA) and Photoshop CS5 (Adobe, San Jose, USA).
Results and discussion
Color alteration of model solution
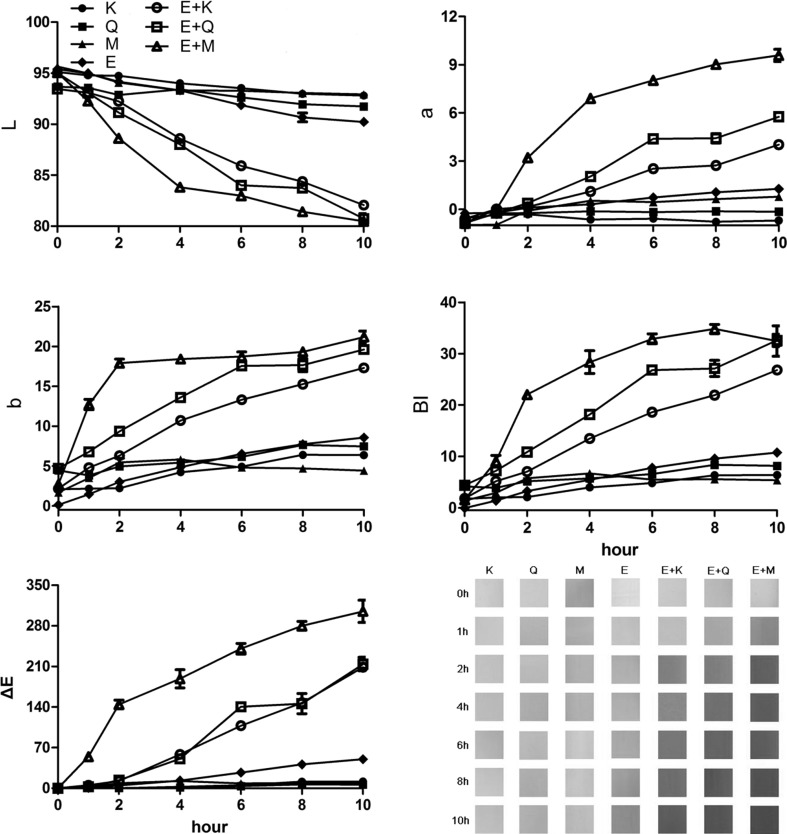
Figure 1 visualizes the color appearance of the model solutions after 0, 1, 2, 4, 6, 8, and 10 h in the condition of thermal treatment. The EGCG solution was colorless before the thermal treatment. However, its color alteration appeared in the condition of the thermal treatment and the model solution resulted in a yellowish/brown color after the 10 h thermal process (Li et al. 2013; Wei et al. 2016). Similarly, the flavonol model solutions also appeared a significant color alteration after the thermal treatment. For instance, the myricetin model solution shifted its color from light yellow to light pink, whereas the color of the kaempferol model solution changed its color from colorless to light green (Fig. 1). These results indicated that these phenolic compounds were sensitive to high temperature. The oxidation of phenolic compounds those were readily induced by thermal treatment could result in the color alternation (Xu et al. 2003; Wang et al. 2002). However, compared with these control solutions, the mixed model solutions showed even more significant in color shift along with the thermal treatment, and they exhibited a dark orange/red color after the treatment (Fig. 1). It has been reported that the oxidation rate of EGCG was significantly increased with the presence of flavonols, and the structure (the hydroxyl groups on the B-ring) of flavonols played a significant role in altering the EGCG oxidation rate (Wang et al. 2002; Maini et al. 2012). Generally, flavonols and flavonol glycosides (such as rutin) have been proposed to cause the color changes of EGCG (Ujihara and Hayashi 2009). In this study, myricetin possesses three hydroxyl groups in its B-ring, whereas quercetin only has two hydroxyl groups in the B-ring. Only one hydroxyl group is attached on the B-ring of kaempferol. These explained why the color alteration was the most obvious in the E + M model solution after the thermal treatment, followed by the E + Q model solution and the least in the E + K model solution.
Fig. 1.
Alteration of color attributes (lightness, L*; redness, a*; yellowness, b*; total color change, ΔE; and browning index, BI in kaemferol, quercetin, myricetin, EGCG, EGCG + kaempferol (E + K), EGCG + quercetin (E + Q), and EGCG + myricetin (E + M) model solution after 0, 1, 2, 4, 6, 8, and 10 h of thermal treatment (Color figure online)
Figure 1 shows the color attributes of these model solutions after 0, 1, 2, 4, 6, 8, and 10 h of the thermal treatment. L*, a*, and b* represent the brightness, redness, and yellowness of the model solution, respectively. ΔE is used to indicate the total color alteration of the model solution, whereas BI stands for the total color degradation caused by browning (Sommano et al. 2011). The mixed model solutions showed a lower value of L* compared with the control solutions, indicated that the mixed model solution can decrease brightness after the thermal treatment. Meanwhile, the thermal treatment resulted in a dramatic increase on the value of a* and b* in the mixed model solutions (especially the E + M solution). This indicated that these mixed model solutions enhanced their redness and yellowness after the thermal treatment. Similarly, these mixed model solutions displayed a higher value of ΔE and BI compared to the controls, indicated that their color alteration was significantly.
UV analysis of model solution
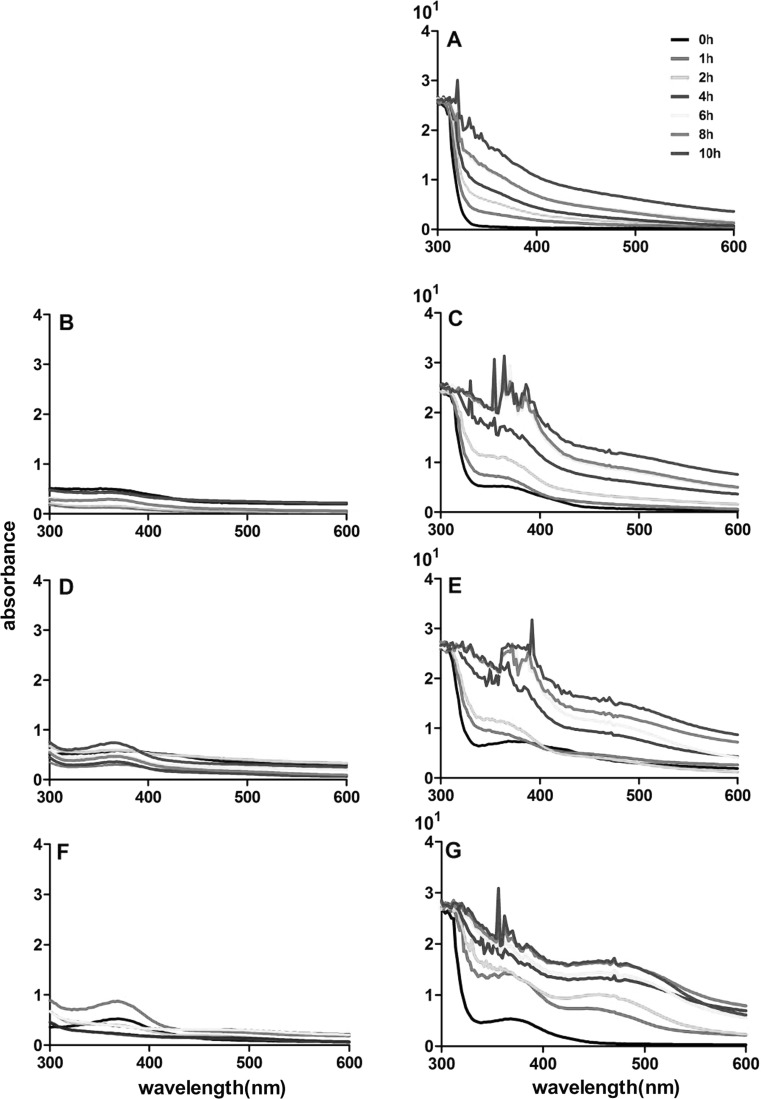
Since the significant color alteration was observed in the mixed model solutions after the thermal treatment, it was quite important to research if the spectrum feature of these solutions was significantly altered. These model solutions after the thermal treatment were analyzed using UV analysis and their spectrum evolution is shown in Fig. 2. The absorption value of the EGCG model solution at the range of 400–600 nm showed an increasing trend along with the thermal treatment period. Additionally, the yellow color feature was more obvious in the model solution with longer thermal period. This alteration of spectrum feature might mainly result from the formation of the EGCG oxidation product in the model solutions after the thermal treatment. However, the absorption value of the flavonol model solutions in this wavelength range could not be compared with the EGCG model solution, and it did not show obvious alteration during the thermal treatment. Interestingly, the mixed model solutions exhibited a totally different spectrum feature compared to the EGCG and the flavonol model solutions after the thermal treatment (Fig. 2). The mixed model solutions, before the thermal treatment (0 h), showed the absorption peaks of EGCG and flavonol. However, thermal treatment resulted in the mixed model solutions with an increase on the absorption value in a wavelength of 380–600 nm. The E + M model solution, compared to other mixed model solutions, exhibited the most obvious absorption peak increase. For example, intensity of λ480nm of EGCG solution was 0.161, λ480nm of myricetin solution was 0.178, however λ480nm of E + M model solution was 0.910 at the heated time of 2 h. The λ480nm of E + M model solution increased with heated time were 1.300, 1.383, 1.586, 1.606 at the heat time of 4, 6, 8, 10 h. More importantly, a new absorption peak at the wavelength range of 410–510 nm was observed in the E + M model solution and it showed a red shift observation. These indicated that the interaction between EGCG and myricetin during thermal treatment might result in the formation of complexes in the model solution, which might lead to such alterations on the spectrum feature of the E + M model solution.
Fig. 2.
Spectrum feature of EGCG, kaemferol, quercetin, myricetin, EGCG, EGCG + kaempferol (E + K), EGCG + quercetin (E + Q), and EGCG + myricetin (E + M) model solution after 0, 1, 2, 4, 6, 8, and 10 h of thermal treatment. a, b, c, d, e, f, and g represent EGCG, kaempferol, EGCG + kaempferol (E + K), quercetin, EGCG + quercetin (E + Q), myricetin, and EGCG + myricetin (E + M) model solution, respectively
HPLC analysis of model solution
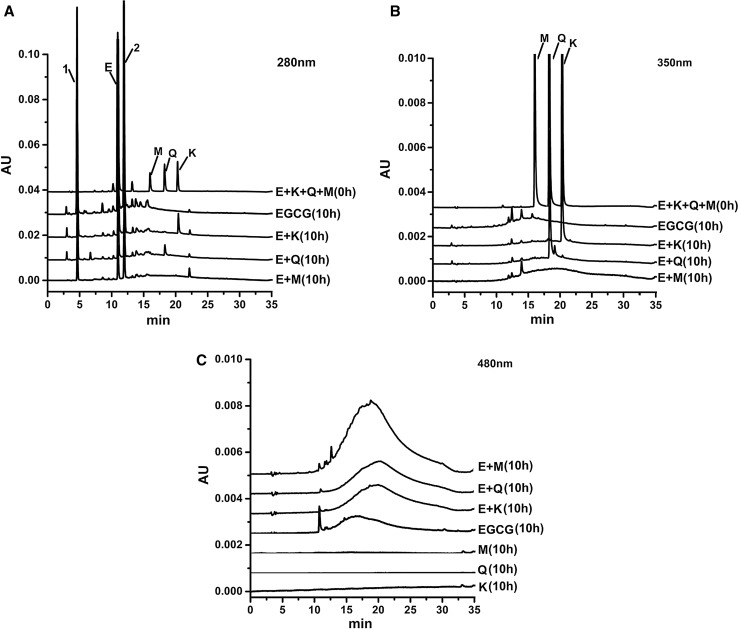
The thermal treatment mainly converted EGCG into gallocatechin gallate (GCG) and gallic acid (Fig. 3a). However, GCG and gallic acid would not contribute to the color alteration of the EGCG model solution due to their color feature (Bailey et al. 1993; Wang and Helliwell 2000; Chen et al. 2001). Meanwhile, kaempferol and quercetin still remained in the E + K and the E + Q model solution after 10 h of the thermal treatment, respectively. However, the E + M model solution did not contain myricetin (Fig. 3b). These indicated that the B-ring structure made myricetin more sensitive to thermal condition than kaempferol or quercetin, and which might be favor of the interaction between EGCG and myricetin during the thermal treatment (Polyakov 1999). Because of focusing on color changes, HPLC chromatograms of K, Q and M alone were monitored at 480 nm, there was no peak before and after thermal treatment, more attention was paid to compare EGCG and mixed model solutions. The EGCG model solution after the thermal treatment displayed a broaden peak at 20 min, which might be due to auto-oxidation of EGCG (Fig. 3c). Auto-oxidation products of EGCG can be monitored at visible wavelength of 480 nm. The similar broaden peak was also observed and enhanced in the mixed model solution at the same condition. However, its retention on the column was altered compared to that which was in the EGCG model solution and their level appeared the differences among the mixed model solutions. These peaks might be the key products contributed to the color alteration of the model solution (Francia-Aricha et al. 1997; Seto et al. 1997).
Fig. 3.
HPLC chromatography of model solution before and after 10 h thermal treatment. Note a HPLC chromatography detected at 280 nm; b HPLC chromatography detected at 350 nm; c HPLC chromatography detected at 480 nm; EGCG + kaempferol + myricetin + quercetin standard before thermal treatment, and EGCG, EGCG + kaempferol (E + K), EGCG + quercetin (E + Q), and EGCG + myricetin (E + M) model solution after 10 h of thermal treatment, respectively. Peak 1, Peak 2, E, M, Q, and K represent gallocatechin gallate (GCG), gallic acid, epigallocatechin gallate (EGCG), myricetin, quercetin, and kaempferol, respectively
Characterization of complexes
In order to investigate whether these peaks after the thermal treatment were important to color alteration, we selected the E + M model solution to collect these two peaks on HPLC system. After the collection, it was observed that the broaden peak fraction exhibited bright pink color, whereas the single peak was colorless. Therefore, we speculated that the major color change of the E + M model solution after the thermal treatment might result from the broaden peak fraction. Therefore, this fraction was further purified on the solid phase extraction and characterized using UV and MS/MS analyses.
UV analysis
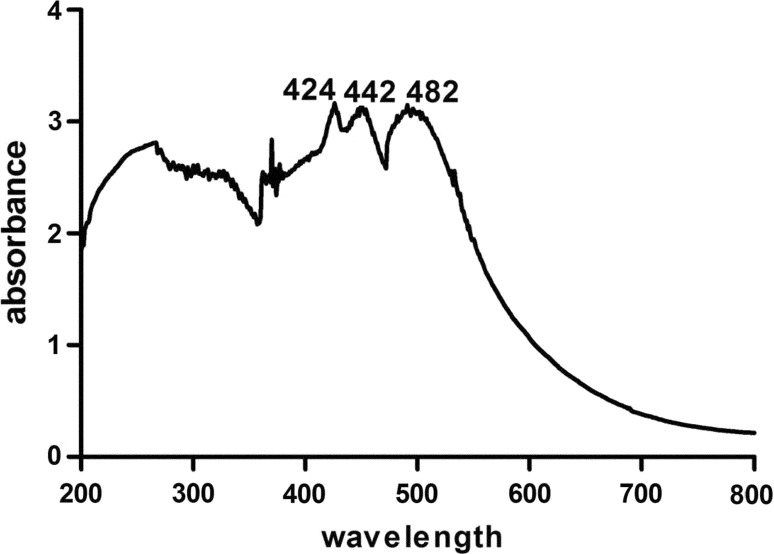
After the purification, the colored complex fraction was freeze-dried and re-dissolved in methanol for the UV analysis (Fig. 4). Its maximal absorption peaks were observed at 424, 442, and 482 nm. This result shown that the colored complexes probably had three absorption peak.
Fig. 4.
UV analysis of colored complexes collected in broaden peak purified from EGCG + myricetin (E + M) model solution after 10 h of thermal treatment
MS/MS analysis
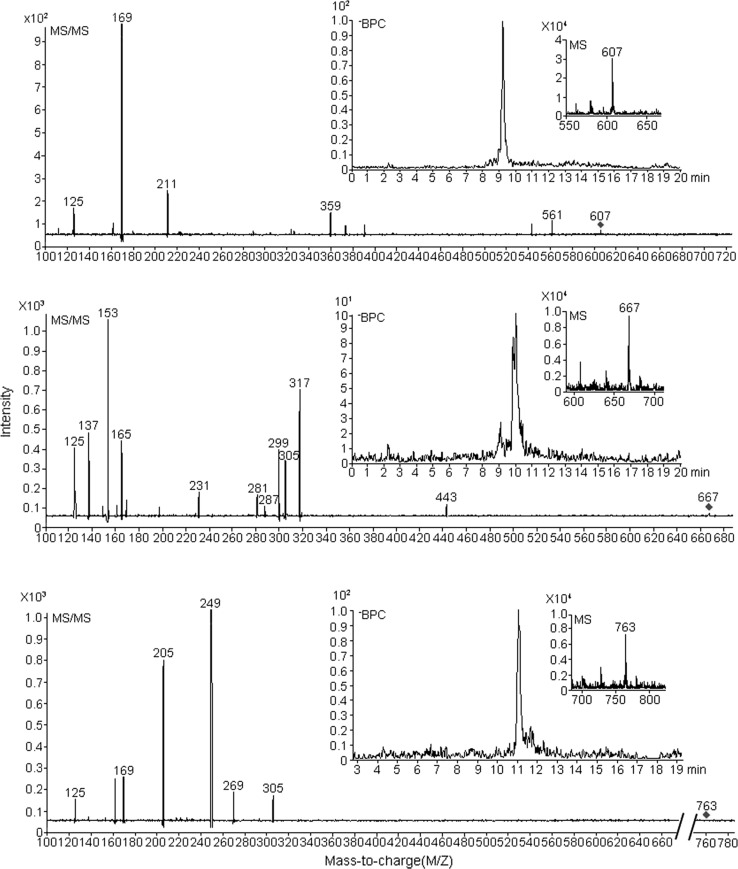
Three main parent ion of m/z 607, 667, 763 were observed in the purified EGCG + M model solution shown in Fig. 5. But the intensity was very weak, their peak areas were only 184, 64, 63 from the mass spectrometry, respectively. This colored complexes were not found in either the EGCG or the myricetin solution, which were analyzed by LC–MS/MS in the negative electron ionization mode.
Fig. 5.
MS/MS analysis of color complexes collected in broaden peak purified from EGCG + myricetin (E + M) model solution after 10 h of thermal treatment
The product ion of m/z 125, 169, 287, and 305 indicated that this component resulted from EGCG (Napolitano et al. 2014). EGCG lost a gallic acyl group to show a product ion of m/z 305, whereas a further dehydration resulted in a formation of m/z 287. A cleavage of 1, 4 bond (1, 4A−) on the C ring of EGCG caused the formation of m/z 125. These product ion were found in the parent ion of m/z 607 and m/z 667, which indicated that these two parent ions likely contain EGCG fragments.
The product ions of m/z 137, 153, 165, 205, 249 and 317 in this component were produced from myricetin. Myricetin was also involved in the structure of this component, since a C3O2 group was cleaved from myricetin to yield a m/z 249, and further loss of a CO2 group resulted in formation of an ion at m/z 205. These product ion were found in the parent ion of m/z 667 and m/z 763, which indicated that these two parent ions must contain myricetin fragments.
Structure of the colored complexes was not quite clear by MS/MS analysis, but it suggest the colored complexes contained the fragments of EGCG and myricetin.
Conclusion
In conclusion, thermal treatment significantly altered the color appearance and attributes of the EGCG and flavonol mixed model solutions. Flavonols during thermal treatment accelerated the oxidation rate of EGCG, and thus enhanced the browning of the mixed model solution. The most obvious color alteration after thermal process was observed in the E + M mixed model solution, followed by the E + Q model solution and the least the E + K model solution. A new absorption peak at the wavelength range of 410–510 nm was observed in the E + M model solution and it showed a red shift observation. The colored complexes were collected and purified from the broaden peak in the E + M model solution after thermal treatment through HPLC and solid phase extraction methods. The complexes showed the maximal absorption peak around 424, 442 and 482 nm. MS/MS analysis confirmed that the complexes resulted from the interaction between EGCG and myricetin during thermal treatment.
Acknowledgements
This study was financially supported by National Nature Science Foundation of China for Young Scholar (Project No: 31101355) and Anhui Provincial Key S&T Special Projects (15czz03116, 1505072038). The authors also sincerely thank Dr. Zheng Li from Food Science and Human Nutrition Department at the University of Florida for the help on revising and editing the manuscript.
Author contribution
Q. Dai and T. Xia designed and supervised the study. Y. He performed the experiment and analyzed data. Q. Dai and Y. He interpreted data and drafted the manuscript. J. Wang, S. Wang, and Y. Yang helped on the experiment preparation and participated in data interpretation. C. Ho helped to the data interpretation.
Compliance with ethical standards
Conflicts of interest
All the authors declare no conflict of interest.
Footnotes
Qianying Dai and Yuanyuan He have equally contributed to this work.
Contributor Information
Qianying Dai, Phone: +86-551-65786469, Email: daiqianying117@163.com.
Tao Xia, Phone: +86-551-65786003, Email: xiatao62@126.com.
References
- Bailey RG, Nursten HE, Mcdowell I. The chemical oxidation of catechins and other phenolics: a study of the formation of black tea pigments. J Sci Food Agric. 1993;63:455–464. doi: 10.1002/jsfa.2740630413. [DOI] [Google Scholar]
- Bazinet L, Araya-Farias M, Doyen A, Trudel D, Têtu B. Effect of process unit operations and long-term storage on catechin contents in EGCG-enriched tea drink. Food Res Int. 2010;43:1692–1701. doi: 10.1016/j.foodres.2010.05.015. [DOI] [Google Scholar]
- Chen Z, Zhu QY, Tsang D, Huang Y. Degradation of green tea catechins in tea drinks. J Agric Food Chem. 2001;49:477–482. doi: 10.1021/jf000877h. [DOI] [PubMed] [Google Scholar]
- Francia-Aricha EM, Guerra MT, Rivas-Gonzalo JC, Santos-Buelga C. New anthocyanin pigments formed after condensation with flavanols. J Agric Food Chem. 1997;45:2262–2266. doi: 10.1021/jf9609587. [DOI] [Google Scholar]
- Helliwell WK. Determination of flavonols in green and black tea leaves and green tea infusions by high-performance liquid chromatography. Food Res Int. 2001;34:223–227. doi: 10.1016/S0963-9969(00)00156-3. [DOI] [Google Scholar]
- Hughes M, Burns J, Lean ME, Matthews D, Crozier A. Survey of the free and conjugated myricetin and quercetin content of red wines of different geographical origins. J Agric Food Chem. 1998;46:368–375. doi: 10.1021/jf970677e. [DOI] [PubMed] [Google Scholar]
- Jiang XL, Liu YJ, Li WW, Zhao L, Meng F, Wang Y, Tan HR, Yang H, Wei CL, Wan XC, Gao LP, Xia T. Tissue-specific, development-dependent phenolic compounds accumulation profile and gene expression pattern in tea plant (Camellia sinensis) PLoS ONE. 2013;8:e62315. doi: 10.1371/journal.pone.0062315. [DOI] [PMC free article] [PubMed] [Google Scholar]
- Jiang H, Engelhardt UH, Thräne C, Maiwald B, Stark J. Determination of flavonol glycosides in green tea, oolong tea and black tea by UPLC compared to HPLC. Food Chem. 2015;183:30–35. doi: 10.1016/j.foodchem.2015.03.024. [DOI] [PubMed] [Google Scholar]
- Kumar PV, Basheer S, Ravi R, Thakur MS. Comparative assessment of tea quality by various analytical and sensory methods with emphasis on tea polyphenols. J Food Sci Tech. 2011;48:440–446. doi: 10.1007/s13197-010-0178-y. [DOI] [PMC free article] [PubMed] [Google Scholar]
- Li N, Taylor LS, Ferruzzi MG, Mauer LJ. Color and chemical stability of tea polyphenol (−)-epigallocatechin-3-gallate in solution and solid states. Food Res Int. 2013;53:909–921. doi: 10.1016/j.foodres.2012.11.019. [DOI] [Google Scholar]
- Liang YR, Ye Q, Jin J, Liang H, Lu JL, Du YY, Dong JJ. Chemical and instrumental assessment of green tea sensory preference. Int J Food Prop. 2008;11:258–272. doi: 10.1080/10942910701299430. [DOI] [Google Scholar]
- Liu JW, Hong-Yu LI, Shi RJ, Guo YY. Determination of content of EGCG and ECG in tea polyphenols by HPLC. Sci Technol Food Ind. 2010;31:372–374. [Google Scholar]
- Maini S, Hodgson HL, Krol ES. The uva and aqueous stability of flavonoids is dependent on B-ring substitution. J Agric Food Chem. 2012;60:6966–6976. doi: 10.1021/jf3016128. [DOI] [PubMed] [Google Scholar]
- Napolitano JG, Gödecke T, Lankin DC, Jaki BU, Mcalpine JB, Chen SN, Pauli GF. Orthogonal analytical methods for botanical standardization: determination of green tea catechins by qNMR and LC–MS/MS. J Pharm Biomed Anal. 2014;93:59–67. doi: 10.1016/j.jpba.2013.06.017. [DOI] [PMC free article] [PubMed] [Google Scholar]
- Neilson AP, Hopf AS, Cooper BR, Pereira MA, Bomser JA, Ferruzzi MG. Catechin degradation with concurrent formation of homo- and heterocatechin dimers during in vitro digestion. J Agric Food Chem. 2007;55:8941–8949. doi: 10.1021/jf071645m. [DOI] [PubMed] [Google Scholar]
- Polyakov VV. Chemical modification of the natural flavonoid myricetin. Chem Nat Compd. 1999;35:21–28. doi: 10.1007/BF02238204. [DOI] [Google Scholar]
- Price KR, Rhodes MJC, Barnes KA. Flavonol glycoside content and composition of tea infusions made from commercially available teas and tea products. J Agric Food Chem. 1998;46:2517–2522. doi: 10.1021/jf9800211. [DOI] [Google Scholar]
- Roberts EAH, Cartwright RA, Wood DJ. The flavonols of tea. J Sci Food Agric. 1956;7:637–646. doi: 10.1002/jsfa.2740071003. [DOI] [Google Scholar]
- Sang S, Lee M, Zhe H, Ho CT, Yang CS. Stability of tea polyphenol (−)-epigallocatechin-3-gallate and formation of dimers and epimers under common experimental conditions. J Agric Food Chem. 2005;53:9478–9484. doi: 10.1021/jf0519055. [DOI] [PubMed] [Google Scholar]
- Seto R, Nanjo FHY, Nakamura H. Preparation of epimers of tea catechins by heat treatment. Biosci Biotechnol Biochem. 1997;61:1434–1439. doi: 10.1271/bbb.61.1434. [DOI] [Google Scholar]
- Sommano S, Kanphet N, Siritana D, Ittipunya P. Correlation between browning index and browning parameters during the senesence of longan peel. Int J Fruit Sci. 2011;11:197–205. doi: 10.1080/15538362.2011.578522. [DOI] [Google Scholar]
- Tsanova-Savova S, Ribarova F. Free and conjugated myricetin, quercetin, and kaempferol in Bulgarian red wines. J Food Compost Anal. 2002;15:639–645. doi: 10.1006/jfca.2002.1099. [DOI] [Google Scholar]
- Ujihara T, Hayashi N. Hypochromic effect of an aqueous monoglucosyl rutin solution caused by green tea catechins. Biosci Biotechnol Biochem. 2009;73:2773–2776. doi: 10.1271/bbb.90514. [DOI] [PubMed] [Google Scholar]
- Wang H, Helliwell K. Epimerisation of catechins in green tea infusions. Food Chem. 2000;70:337–344. doi: 10.1016/S0308-8146(00)00099-6. [DOI] [Google Scholar]
- Wang LF, Kim DM, Lee CY. Effects of heat processing and storage on flavanols and sensory qualities of green tea beverage. J Agric Food Chem. 2000;48:4227–4232. doi: 10.1021/jf0003597. [DOI] [PubMed] [Google Scholar]
- Wang LF, Kim DM, Lee CY. Interaction of flavanols in green tea extract during heat processing and storage. Food Sci Biotechnol. 2002;11:4227–4232. [Google Scholar]
- Wang LF, Park SC, Chung JO, Baik JH, Park SK. The compounds contributing to the greenness of green tea. J Food Sci. 2004;69:S301–S305. doi: 10.1111/j.1365-2621.2004.tb09894.x. [DOI] [Google Scholar]
- Wang M, Yang R, Zhao W, Baik JH, Park SK. Effects of heat and pulsed electric fields on bioactive components and color of green tea infusions. Inter J Food Eng. 2004;4:99–107. [Google Scholar]
- Wei Y, Chen P, Ling T, Wang Y, Dong R, Zhang C, Zhang LJ, Han MM, Wang DX, Wan XC, Zhang JS. Certain (–)-epigallocatechin-3-gallate (EGCG) auto-oxidation products (EAOPs) retain the cytotoxic activities of EGCG. Food Chem. 2016;204:218–226. doi: 10.1016/j.foodchem.2016.02.134. [DOI] [PubMed] [Google Scholar]
- Wu C, Xu H, Héritier J, Andlauer W. Determination of catechins and flavonol glycosides in chinese tea varieties. Food Chem. 2012;132:144–149. doi: 10.1016/j.foodchem.2011.10.045. [DOI] [PubMed] [Google Scholar]
- Xie HQ, Wang GG, Guo JS. Effects of pH and temperature on reaction kinetics of catechins in green tea infusion. Biosci Biotechnol Biochem. 1993;57:907–910. doi: 10.1271/bbb.57.907. [DOI] [Google Scholar]
- Xu JZ, Leung LK, Huang Y, Chen ZY. Epimerisation of tea polyphenols in tea drinks. J Sci Food Agric. 2003;83:1617–1621. doi: 10.1002/jsfa.1597. [DOI] [Google Scholar]
- Zhang Y, Chen H, Zhang N, Ma L. Antioxidant and functional properties of tea protein as affected by the different tea processing methods. J Food Sci Technol. 2015;52:742–752. doi: 10.1007/s13197-013-1094-8. [DOI] [PMC free article] [PubMed] [Google Scholar]


