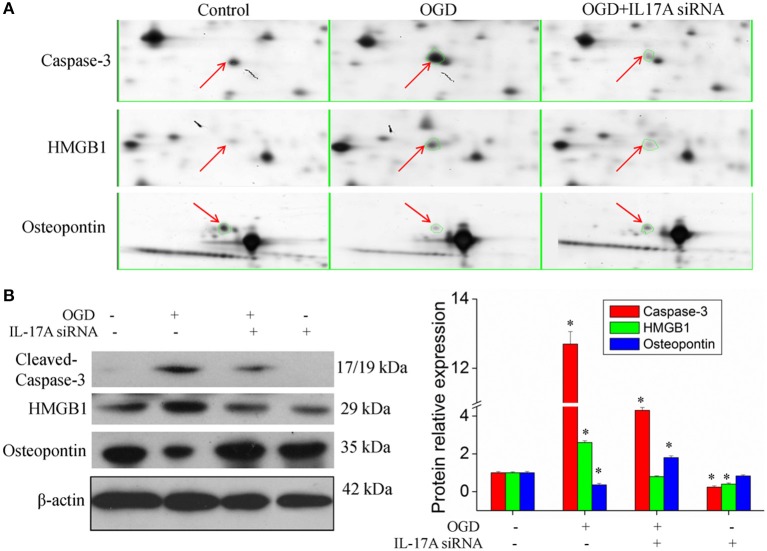
Figure 5.
Validation of IL-17A regulatory proteins. (A) Typical examples of some differentially expressed protein spots with at least two-fold changes in EOC 2 cells, EOC 2 cells in an OGD model and EOC 2 cells transfected with IL-17A siRNA in OGD model by 2-DE. (B) EOC 2 cells were transfected with IL-17A siRNA for 24 h, then started the OGD for 2 h and reperfusion for 24 h, and the expression of cleaved-caspase-3, HMGB1 and osteopontin was measured by Western blot analysis. *P < 0.05 vs. the control.

