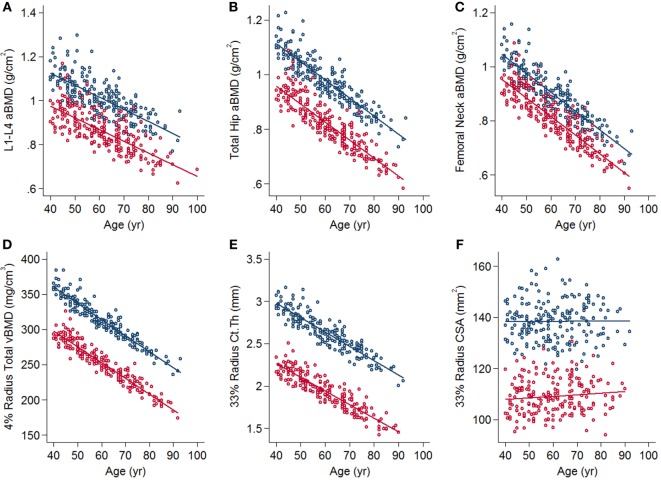
Figure 4.
Associations between age and clinically relevant bone outcomes (A) L1–L4 areal bone mineral density (aBMD), (B) total hip aBMD, (C) femoral neck aBMD, (D) 4% radius total volumetric BMD, (E) 33% radius cortical thickness, and (F) 33% radius cross-sectional area. Scatter plots are from linear regression with adjustments for sex, weight, and height. Blue lines and dots represent men and red lines and dots represent women.

