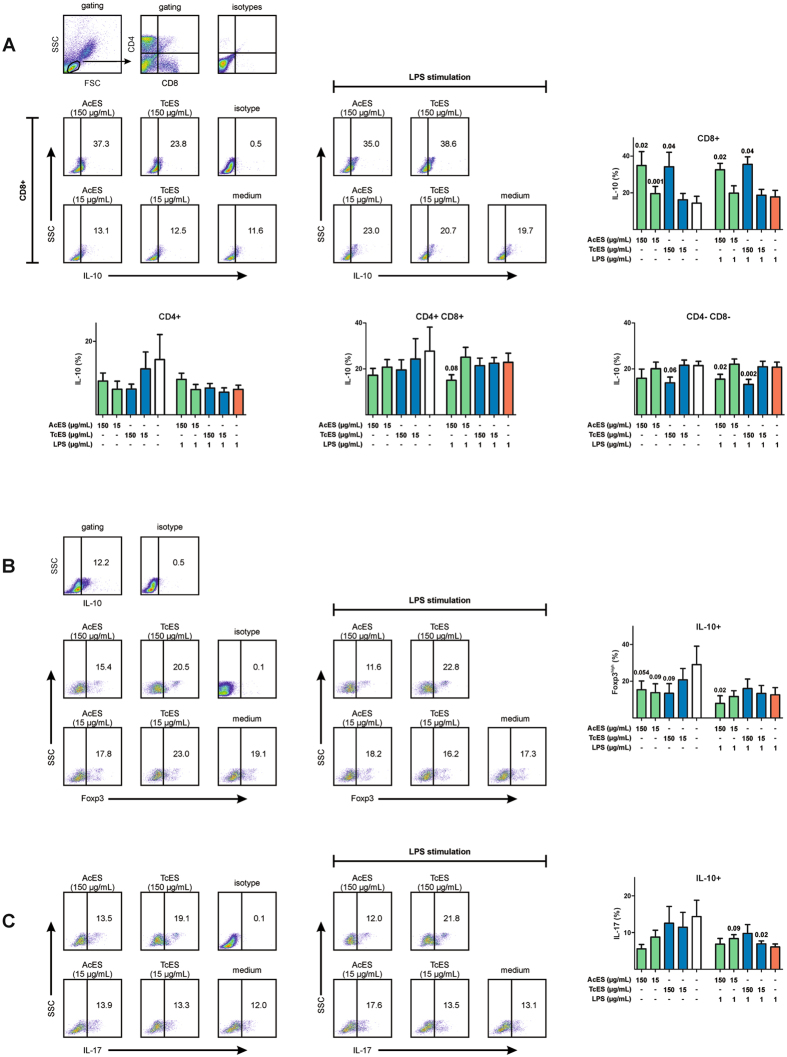
Figure 3.
Characterisation of IL-10+ lymphocytes. (A) Three-colour flow cytometry showed CD8+ lymphocytes to be the main source of ES-induced IL-10 expression. In contrast, CD4- CD8- double-negative lymphocytes revealed lower IL-10 expression after ES treatment at 150 µg/mL. (B) ES antigens were associated with a mild decrease in Foxp3high cells within IL-10+ lymphocytes in the absence of LPS stimulation, although the finding failed to reach statistical significance. For AcES at 150 µg/mL, this effect was more obvious when cells were stimulated with LPS (C) Co-staining for IL-17 showed ES antigens to be capable of elevating IL-17 expression in LPS-stimulated IL-10+ lymphocytes and this effect was significant for TcES at 15 µg/mL. Although the data may suggest a decrease in IL-17 expression by unstimulated IL-10+ lymphocytes this effect failed to reach statistical significance. P-values were calculated according to paired t-test. Error bars illustrate standard error of mean (SEM). FSC = forward scatter, SSC = side scatter. Experiments were repeated six times at two different time points.

