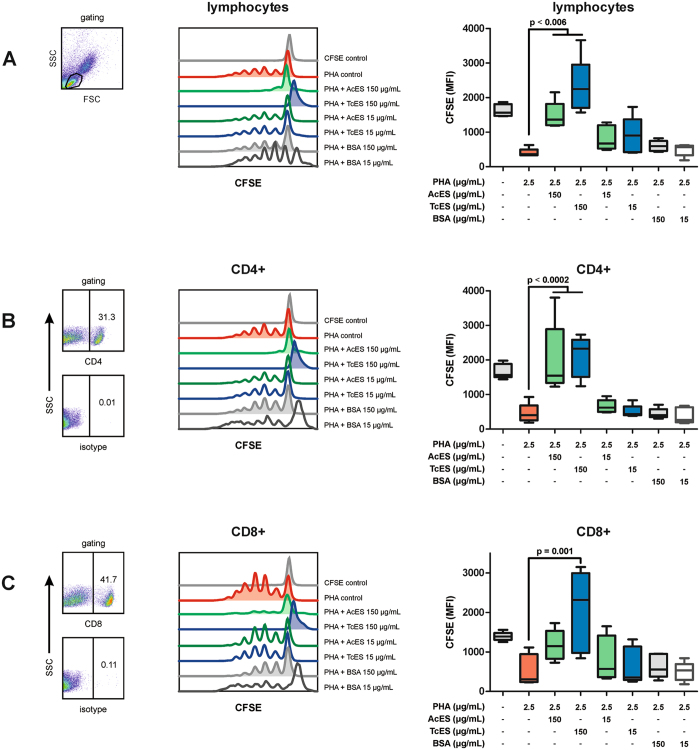
Figure 4.
T cell proliferation assay. Cultivating CFSE-stained PBMCs in the presence of ES antigens revealed TcES to be capable of reducing PHA-induced lymphocyte proliferation (A) at 150 µg/mL and this was detectable in both CD4+ (B) and CD8+ (C) T cells. AcES showed similar effects in lymphocytes and CD4+ cells, while the anti-proliferative capability was lower with loss of statistical significance in CD8+ T cells. P-values were calculated according to one-way ANOVA followed by the Tukey’s honest significant difference post-hoc test. Error bars represent standard error of mean (SEM). FSC = forward scatter, SSC = side scatter. Experiments were repeated six times at two different time points.

