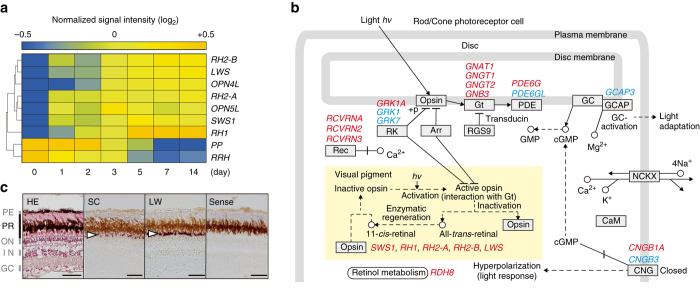
Fig. 2.
Genome-wide expression analysis of the eye reveals dynamic seasonal changes in phototransduction. a Clustered organization of seven upregulated and two downregulated opsin genes following a long day/warm temperature (LW) stimulus. Data were normalized over the complete data set. The color scale represents the normalized signal intensity. b Seasonal changes in the expression of genes encoding photopigments and their downstream phototransduction pathways. Gene symbols in red and blue indicate up- and downregulated genes, respectively. Adapted from the KEGG (Kyoto Encyclopedia of Genes and Genomes) phototransduction pathway. c In situ hybridization analysis confirmed LW induction of LWS opsin in the photoreceptor layer (GC ganglion cell layer, IN inner nuclear layer, ON outer nuclear layer, PE pigment epithelium, PR photoreceptor layer). Representative images from the central area of the retina (also see Supplementary Fig. 6). White arrow indicates the hybridization signal. Scale bar: 50 µm

