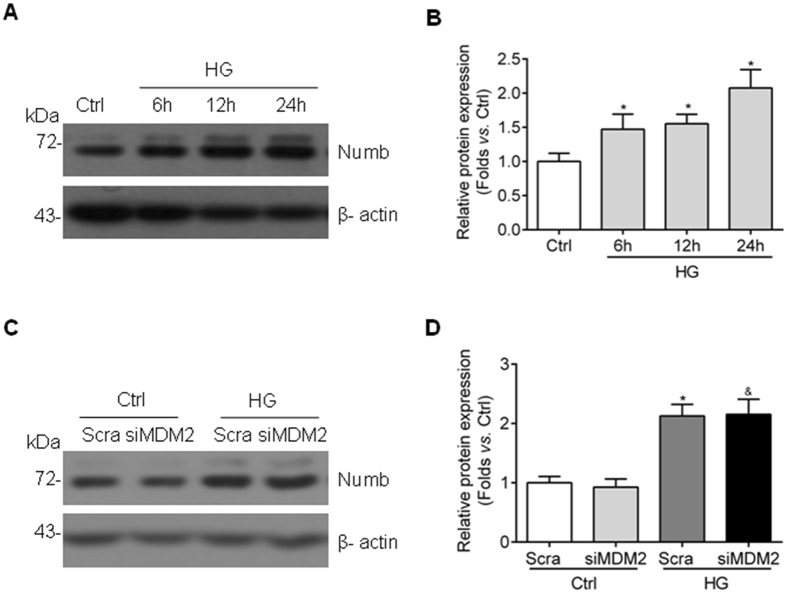
Figure 6.
Numb expression is upregulated by high glucose simulation in GMCs and not affected by MDM2 inhibition. (A) Representative western blot images and (B) summarized data showing the Numb protein level in HBZY-1 with high glucose treatment at indicated time points n = 6. * P < 0.05 vs. Ctrl. (C) Representative western blot images and (D) summarized data showing that the abundance of Numb is not influenced by MDM2 inhibition n = 6. * P < 0.05 vs. Ctrl + Scra; & P > 0.05 vs. HG + Scra.

