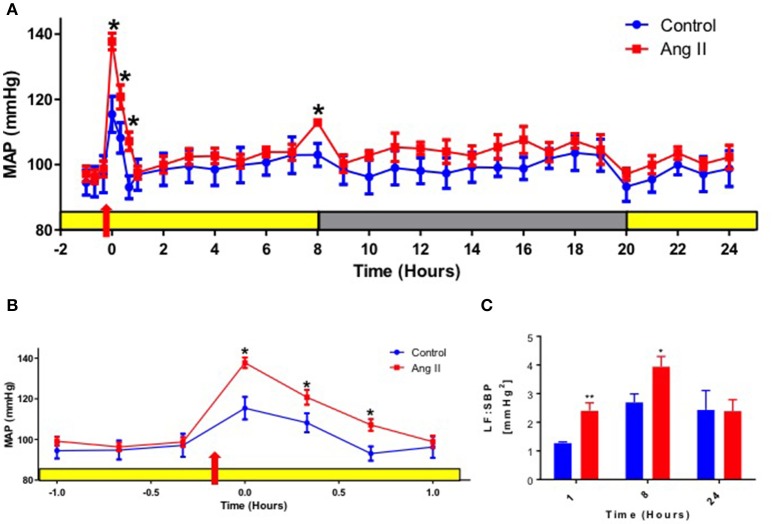
Figure 1.
Effects of systemic Ang II injection on blood pressure. (A) Mean arterial pressure (MAP) over 24 h in WKY rats injected with Ang II (red) or control saline I.P. (blue). Yellow bar represents daylight period, and gray represents night time period. Red arrow represents time of Ang II injection, 10 min prior to recording at time zero. (B) A re-plotted diagram of MAP effects highlighting 1 h prior and post-Ang II (red) or control saline injection (blue). (C) Power spectral analysis of systolic blood pressure (SBP) signal at 1,8 and 24 h post Ang II injection (red bars) vs. control saline-injected WKY at the equivalent time points (blue bars). ±SEM. N = 6 per group. Unpaired Student Ttest was used in B and C. *p < 0.05 vs. control, **p < 0.01 vs. control.

