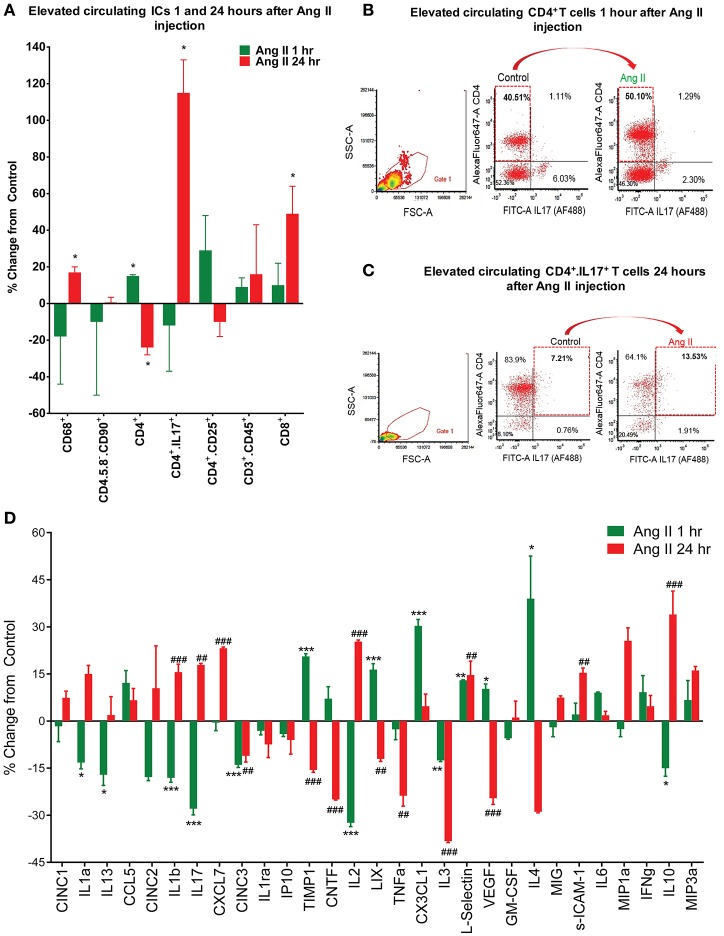
Figure 2.
Effects of systemic Ang II injection on peripheral and central immune response. (A–C) Quantification of circulating inflammatory cells show an increase in CD4+ T cells even at 1 h post-Ang II injection (A,B) and persistence of CD4+/IL17+ T cells, amongst others, at 24 h post-Ang II injection (A,C). In (D), changes in PVN cytokine levels following a single Ang II injection I.P., as measured by ELISA at 1 h (green bars) and 24 h (red bars) following the injection. ±SEM. N = 46 per group, *P < 0.05, **##P < 0.01, ***###P < 0.001, vs. respective control. ICs, inflammatory cells.

