Figure 5.
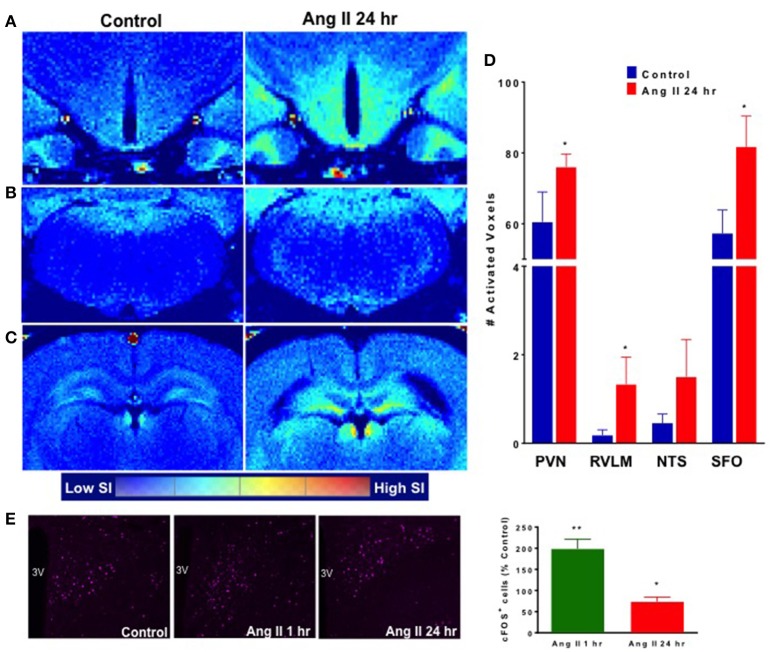
Effect of systemic Ang II injection on cardioregulatory brain regions. Manganese-labeled hypothalamic (A), brainstem (B) and circumventricular (C) activity following control injection (left) and 24 h following Ang II injection (right). (D) Quantification of activated voxels in the PVN, RVLM, NTS and SFO, 24 h following Ang II injection (red bars). (E) Quantification of Fos expression in the PVN (purple) at 1 and 24 h following Ang II injection. ±SEM. N = 4–6 per group, Unpaired Student Ttest was used in D and E. **p < 0.01, *p < 0.05 vs. control.

